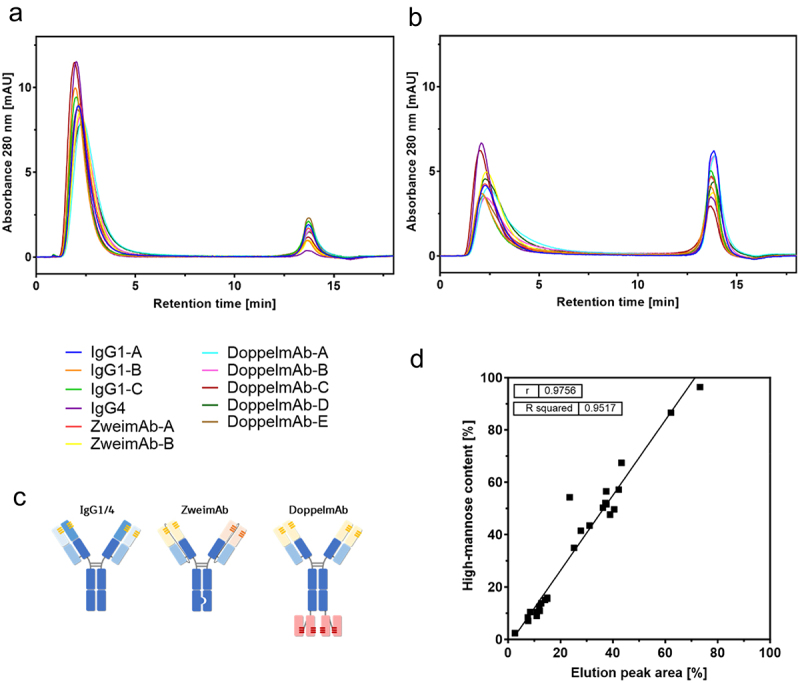
Figure 3.

MR-AC analysis of mAbs differing in their sequence and format. The chromatograms of the reference mAbs (a) and the ConA product pools (b) of 11 different mAbs are overlayed. The schematic illustration of the different formats is shown (c). The elution peak areas of the MR-AC analysis are correlated with the respective high-mannose content of the mAbs (d).
