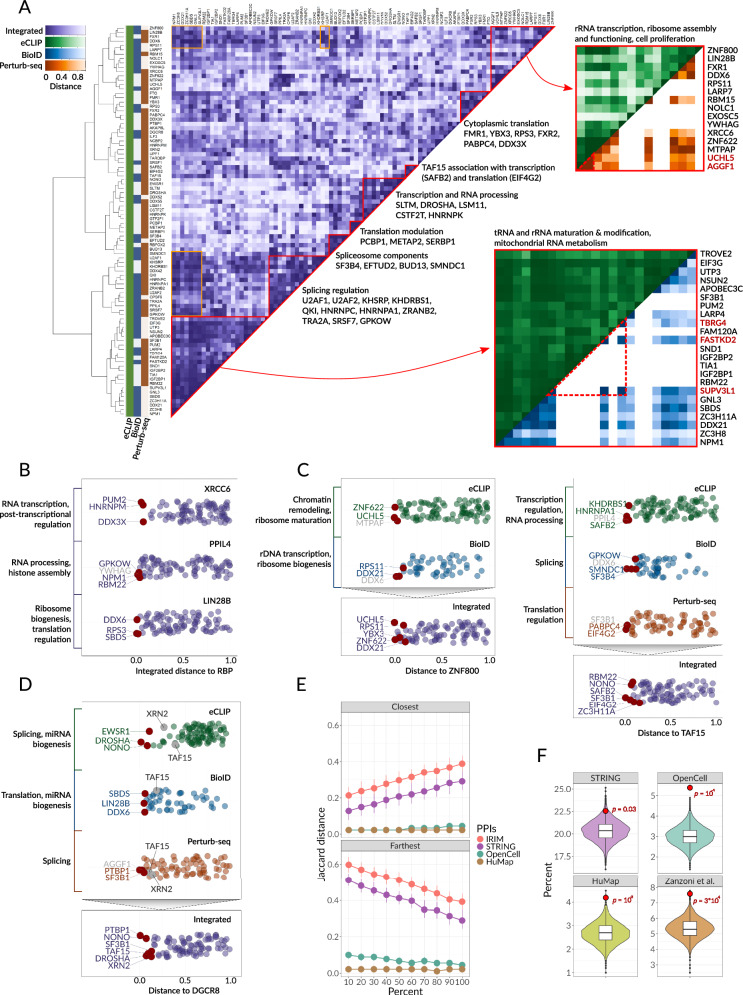
Fig. 2. Unveiling post-transcriptional regulatory modules through integrative analysis of RBP-RBP interactions.
A Integrated Regulatory Interaction Map (IRIM): This heatmap displays integrated distances between RBPs, where each cell’s color denotes the integrated distance between the corresponding RBPs. Hierarchical clustering is illustrated by the dendrogram to the left. The colormap signifies the inclusion of RBPs in three data sources: eCLIP (green), BioID (blue), and Perturb-seq (brown). Recognized regulatory modules are emphasized in red with contributing RBPs labeled directly on the plot. Insets present detailed heatmaps for two exemplary modules, colored respectively for source datasets: BioID (blue), Perturb-seq (orange), and eCLIP (green). Proteins discussed are highlighted in red, and examples of module interplay, including U2AF1 and KHSRP, are marked in orange. Source data are provided as a Source Data file. B Swarm Plots for RBP Partners of XRCC6, PPIL4, and LIN28B: Swarm plots illustrate the RBP partners for XRCC6 (top), PPIL4 (middle), and LIN28B (bottom), with each point representing an individual RBP. The points are organized by the integrated distance from the specified RBP to the query RBP. Annotations within each plot designate the common function of the closest interacting partners. The three RBPs with the smallest distances are specifically labeled; those associated with a common function are marked in purple, and the others in gray. Source data are provided as a Source Data file. C Identification of RBP Partners of ZNF800 and TAF15: The swarm plots here delineate the RBP partners of ZNF800 (left) and TAF15 (right), employing the same color-coding for datasets as in (A): eCLIP (green), BioID (blue), and Perturb-seq (brown). The top portion represents the RBP partners as derived from individual datasets, each annotated with the common function of the nearest interacting partners. The bottom portion, analogous to (B), displays the RBP partners sorted by the integrated distance, with the top interacting RBPs distinctly labeled according to the common function in purple and the others in gray. Source data are provided as a Source Data file. D Examination of RBP Partners of DGCR8: This section presents swarm plots of the RBP partners of DGCR8. The top plots showcase the partners based on individual source datasets, similar to (C), with each plot annotated and color-coded according to (A). The bottom plot displays the RBP partners sorted by integrated distance, highlighting the top interacting RBPs. Notably, TAF15 and XRN2 are emphasized, illustrating the efficacy of the distance integration procedure in confirming the known involvement of DGCR8 in the regulation of transcription. Source data are provided as a Source Data file. E Rearrangements in RBP matrices: This panel demonstrates the alterations in the structure of the Integrated Regulatory Interaction Map matrix due to random shuffling, depicting changes in distance to the closest and farthest partner RBP. Downsampling was conducted by shuffling distance values of varying fractions of RBPs (0% to 100%). This procedure was performed 10 times for each of 90 RBP, resulting in 900 estimates for each dataset and shuffling percent. Dots represent the median, error bars represent the lower and upper quartiles. Source data are provided as a Source Data file. F Percent of RBP pairs passing IRIM distance < 25% quantile that intersect STRING, OpenCell, hu.Map, and Zanzoni et al.23. Violin and boxplots are based on 104 random shuffling iterations; red dots represent the percent of the real IRIM distances. Right-tailed p-values were obtained for each group by calculating a fraction of random shuffling iterations with the intersection greater or equal to the observed value (among 104 + 1 cases). Box plot bounds and center represent the first, second, and third quartiles, while whiskers represent minimum and maximum values in the data, excluding outliers that are more than 1.5 interquartile range from lower and upper quartiles and are depicted as dots. Source data are provided as a Source Data file.

