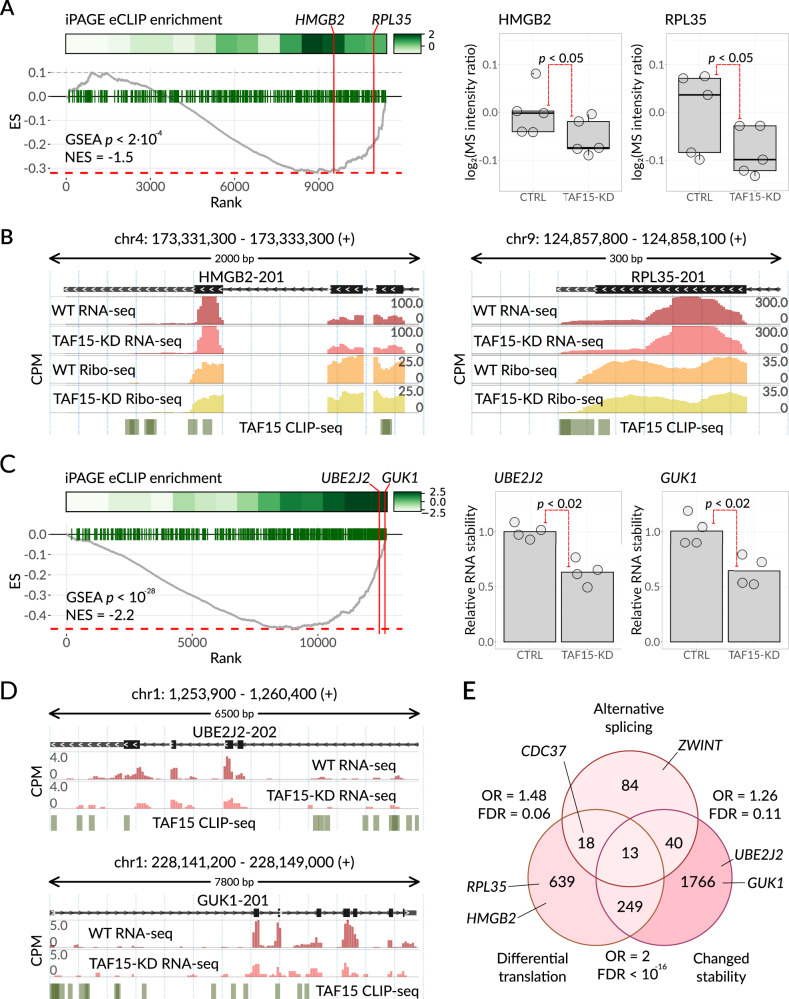
Fig. 5. TAF15 is directly involved in RNA translation and stability regulation.
A Left: enrichment analysis of TAF15 mRNA targets among the differentially translated genes (in the TAF15-KD cell line compared to the WT cell line). The differential ribosome occupancy (RO) measurements in TAF15-KD cells were estimated from Ribo-seq. The genes were sorted based on the RO change (along the x-axis), and the enrichment of TAF15 mRNA targets, inferred from eCLIP data, was calculated using iPAGE (top subpanel) and with GSEA (bottom subpanel, ES stands for the enrichment score). Two example targets, HMGB2 and RPL35, are highlighted. Right: levels of HMGB2 and RPL35 were measured by mass spectrometry in control K562 and TAF15-KD cells. N = 5 biological replicates. P-value from one-sided Wilcoxon rank sum test, 0.04762 for both HMGB2 and RPL35. Source data are provided as a Source Data file. B Genomic view of HMGB2 (left) and RPL35 (right). RNA-seq and Ribo-seq WT and TAF15-KD profiles, as well as TAF15 CLIP-seq peaks, are shown below. Y-axis: counts per million (CPM). C Left: enrichment analysis of TAF15 mRNA targets among the differentially stabilized transcripts (in TAF15-KD cell line compared to WT cell line) measured by α-amanitin treatment. The transcripts were sorted based on stability change (log2FCs). The enrichment of TAF15 RNA targets, inferred from eCLIP data, was calculated with iPAGE (top and middle subpanel) and with GSEA (bottom subpanel). Two example targets, UBE2J2 and GUK1, are highlighted. Right: relative stability of UBE2J2 and GUK1 mRNAs were measured as mRNA to pre-mRNA abundances ratio using qPCR in control K562 and TAF15-KD cells. N = 4 biological replicates. P-value from one-sided Wilcoxon rank sum test, 0.01429 for UBE2J2 and 0.0147 for GUK1. Source data are provided as a Source Data file. D Genomic view of UBE2J2 (top) and GUK1 (bottom). RNA-seq WT and TAF15-KD profiles, as well as TAF15 CLIP-seq peaks, are shown below. Y-axis: counts per million (CPM). E Venn diagram of TAF15 RNA regulons. Shown are the numbers of genes that exhibit significant changes in splicing (155 genes with Bayes factor ≥ 10), translation (919 genes with FDR < 0.05), or stability (2068 genes with FDR < 0.05) upon TAF15 knockdown, as captured by RNA-seq, Ribo-seq, and RNA-seq with α-amanitin, respectively. Results of one-sided Fisher’s exact test for each pairwise intersection were FDR-corrected for multiple testing and are shown next to the corresponding area. Source data are provided as a Source Data file.

