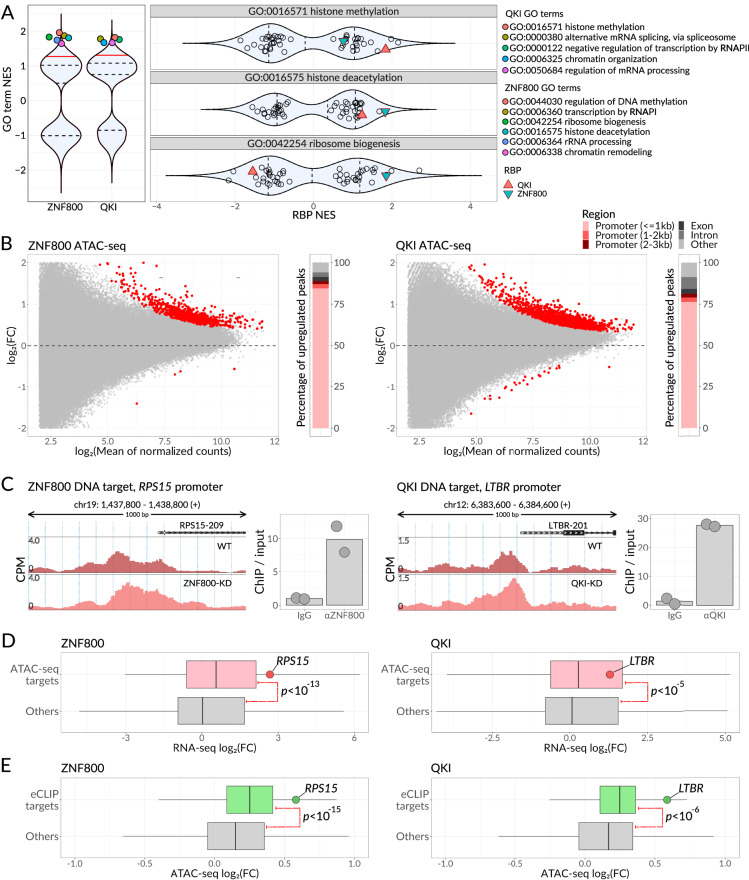
Fig. 6. ZNF800 and QKI control gene expression at transcriptional and post-transcriptional levels independently.
A Violin plot showing the normalized enrichment scores (NES) resulting from gene set enrichment analysis of proximity labeling data. Left subpanel: NES scores across all the GO-BP terms for ZNF800 and QKI proteins. The 5 highest scoring pathways are highlighted with color. Right subpanel: NES scores across all the studied RBPs for GO:0016571, GO:0016575, and GO:0042254 GO terms. ZNF800 and QKI are highlighted with colored triangles. Dashed lines: quartiles; solid red line: 0.9 quantile. B Volcano plots showing differential chromatin accessibility between WT K562 cells and ZNF800-KD (left) or QKI-KD (right) cells. Each point denotes a single ATAC-seq peak; peaks passing 0.1 FDR are colored red. The distribution of peaks among various genomic regions is shown on the right of each volcano plot. Source data are provided as a Source Data file. C Genomic view of RPS15 (left) and LTBR (right) promoter regions. ATAC-seq profiles of WT cells along with ZNF800-KD (left) or QKI-KD (right) are shown. The Binding of ZNF800 to the RPS15 promoter region and the binding of QKI to the LTBR promoter region were measured by ChIP-qPCR in K562 cells and are illustrated on the right of each profile plot. Source data are provided as a Source Data file. D Box plots showing the distributions of expression fold changes in WT cells compared to either ZNF800-KD cells (left) or QKI-KD cells (right), as measured by RNA-seq. The distributions for the genes showing significant promoter accessibility increase upon the respective knockdown and for the rest of the genes are shown separately. The top most highly accessible ATAC-seq peak was considered for each gene resulting in 21708 genes in both ZNF800-KD and QKI-KD cells, of which 834 (3.8%) and 1476 (6.8%) had their promoters accessibility increased upon ZNF800 and QKI knockdown, respectively. P-value calculated by one-sided Wilcoxon rank sum test, 8.1·10−14 for ZNF800-KD and 2.64·10−6 for QKI-KD. Box plot bounds and center represent the first, second, and third quartiles, while whiskers represent minimum and maximum values in the data, excluding outliers that are more than 1.5 interquartile range from lower and upper quartiles and are depicted as dots. Source data are provided as a Source Data file. E Box plots depicted as in (D) showing the distributions of chromatin accessibility fold changes in WT cells compared to either ZNF800-KD cells (left) or QKI-KD cells (right), as measured by ATAC-seq. The distributions for ZNF800- or QKI- RNA targets (as defined by eCLIP) and the rest of the genes are shown separately. In total, there are 23275 ATAC-seq peaks, with 714 assigned to ZNF800 RNA target genes (leaving 22561 as non-target) and 286 assigned to QKI RNA target genes (leaving 22989 as non-target). P-value calculated by one-sided Wilcoxon rank sum test, 6.81·10−20 for ZNF800-KD and 2.3·10−7 for QKI-KD. Source data are provided as a Source Data file.

