Figure 1.
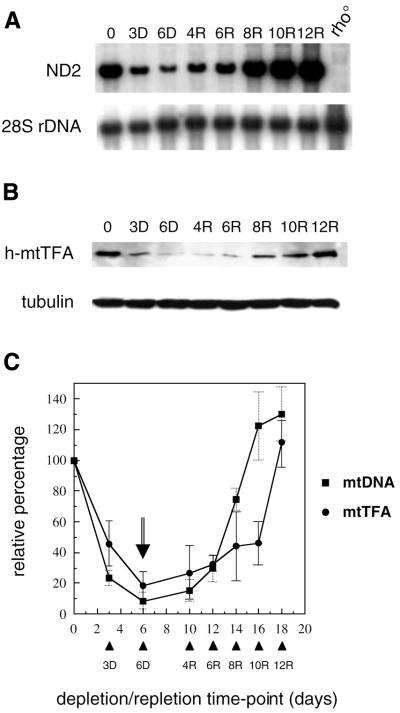
Delayed accumulation of h-mtTFA after mtDNA depletion in HeLa cells. (A) Southern analysis of nuclear DNA (28S rDNA gene) and mtDNA (ND2 gene) from cells partially depleted and then repopulated with mtDNA. Shown is the analysis of total DNA samples from HeLa Tet-On cells prior to treatment with EB (time 0); cells depleted of mtDNA with EB for 3 (3D) and 6 days (6D); and cells subsequently grown in the absence of EB (mtDNA recovery) for 4 (4R), 6 (6R), 8 (8R), 10 (10R) and 12 days (12R). Also shown is total DNA from a corresponding rho° cell line that is devoid of mtDNA. (B) Immunoblot analysis of h-mtTFA and tubulin in total protein (20 µg) from the samples described in (A) above. (C) Quantitative analysis of data from (A) and (B) above (see Materials and Methods). Plotted on the ordinate is the relative percentage (amount relative to time 0) of h-mtTFA (circles) or mtDNA (squares) at each time point during the depletion–repletion experiment [numbers directly below the graph indicate the total time of the experiment in days; specific time points in the depletion–repletion experiment are indicated by arrowheads and labeled as in (A) above]. The point in the experiment when cells were removed from EB is indicated by the arrow. Error bars (solid, h-mtTFA; dashed, mtDNA) indicate ± one standard deviation from the mean of three independent experiments.

