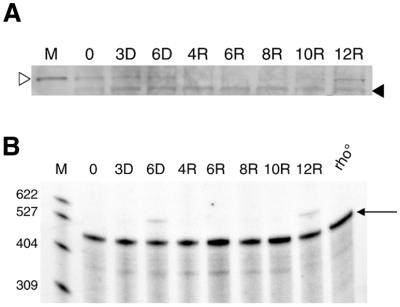
Figure 3.
Dynamics of mtRNA polymerase during mtDNA depletion–repletion in HeLa cells. (A) Western immunoblot analysis of h-mtRNA polymerase during a typical mtDNA depletion–repletion experiment. A control lane (labeled M) is included in the upper panel. This lane contains a mitochondria-enriched HeLa cell fraction, demonstrating that the band indicated by the open arrowhead is mtRNA polymerase. A cross-reacting, non-mitochondrial protein (indicated by a filled arrowhead) that is not affected by EB treatment serves as a convenient estimate of the amount of protein loaded in each lane. (B) Results of RNase protection analysis of h-mtRNA polymerase mRNA during mtDNA depletion–repletion are shown. Radiolabeled DNA size markers (M) were run with the samples and the numbers to the left of the figure indicate their length in nucleotides. The 448 nt signal (indicated with an arrow) represents the protected h-mtRNA polymerase mRNA fragment. Time points during mtDNA depletion–repletion are indicated in (A) and (B) in the same manner as in Figure 1.

