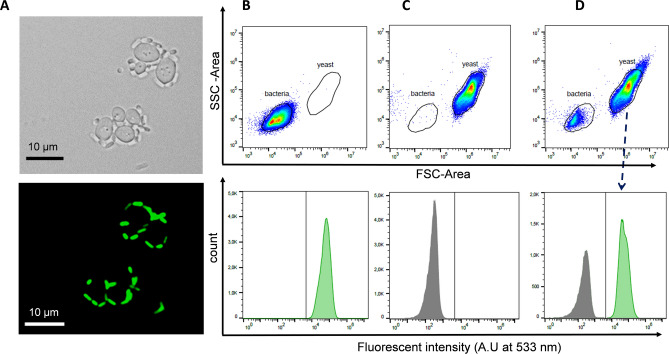
Figure 1.
Flow cytometry measurements of bacteria—yeast adhesion. (A) Microscopy bright field and fluorescence images of incubation mixture of the E. coli E22 (109 cells/ml) expressing the green fluorescent protein Dendra2 with 108 BY4741 yeast cells/ml in PBS buffer. (B, C) Representative flow cytometry dot plots SSC-Area vs FSC-Area and corresponding fluorescence intensity histograms of E. coli E22 cells expressing the green fluorescent protein Dendra-2 (B) and S. cerevisiae BY4741 strain (C). In (D) is shown the flow cytometry dot plot SSC-Area vs FSC-Area of the mix yeast and bacteria and fluorescence intensity histogram of the yeast population (as indicated by the arrow).

