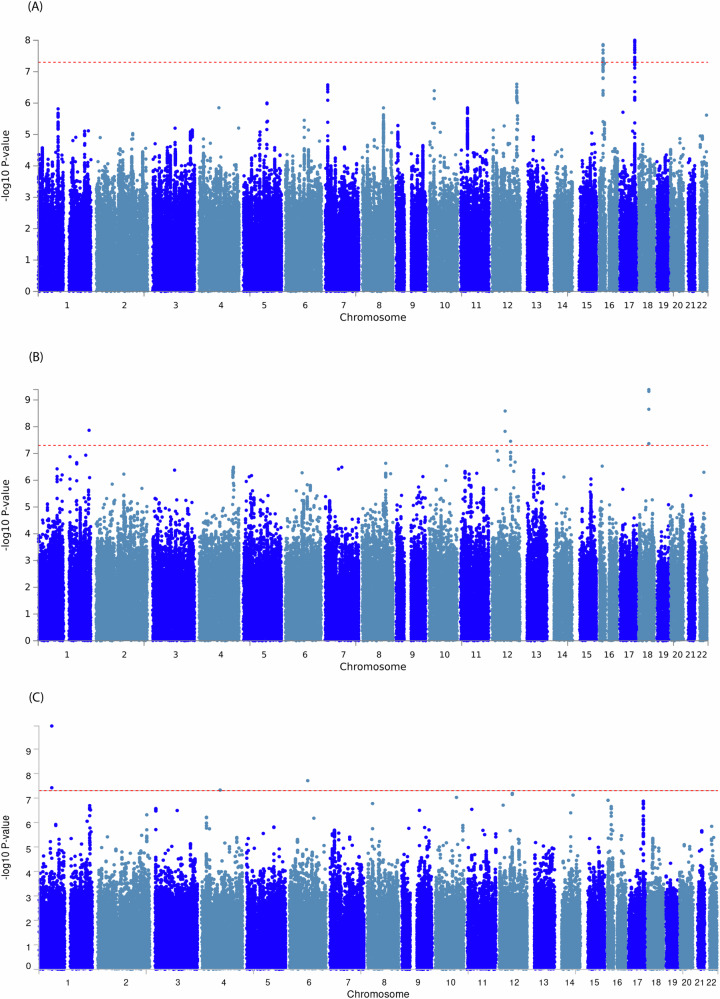
Fig. 1. Manhattan plots for the meta-analysis of genome-wide association study (GWAS) of the blood levels of neurofilament light (NfL).
Manhattan plot based on GWAS meta-analysis of the European ancestry (A), African- American ancestry (B), and Trans-ethnic participants (C). The Observed associations of all tested genetic variants on autosomal chromosomes (X-axis) are displayed as –log10(P values) on the Y-axis. The red dotted horizontal line indicates a genome-wide significant association (P value < 5 × 10⁻⁸) with NfL levels in blood.

