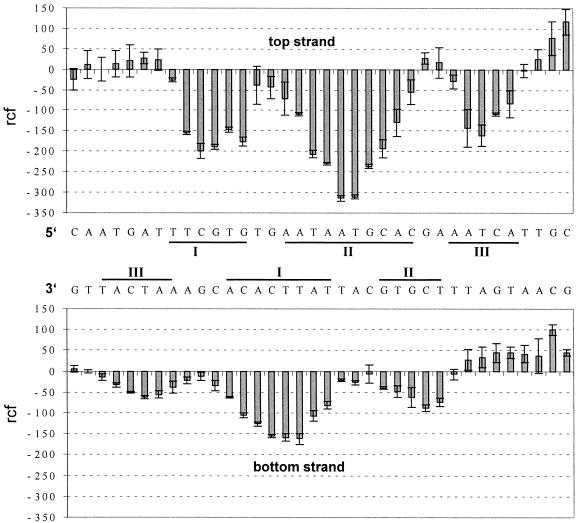
Figure 2.
Histogram of the hydroxyl radical footprinting. Upper panel, top strand; lower panel, bottom strand. The relative cutting frequency (arbitrary units) of the bound DNA compared to the unbound control is shown. The bars represent average values from four and six experiments for the top strand and the bottom strand, respectively. The error bars show the standard deviation. Protection sites I, II and II are indicated.

