Fig. 4.
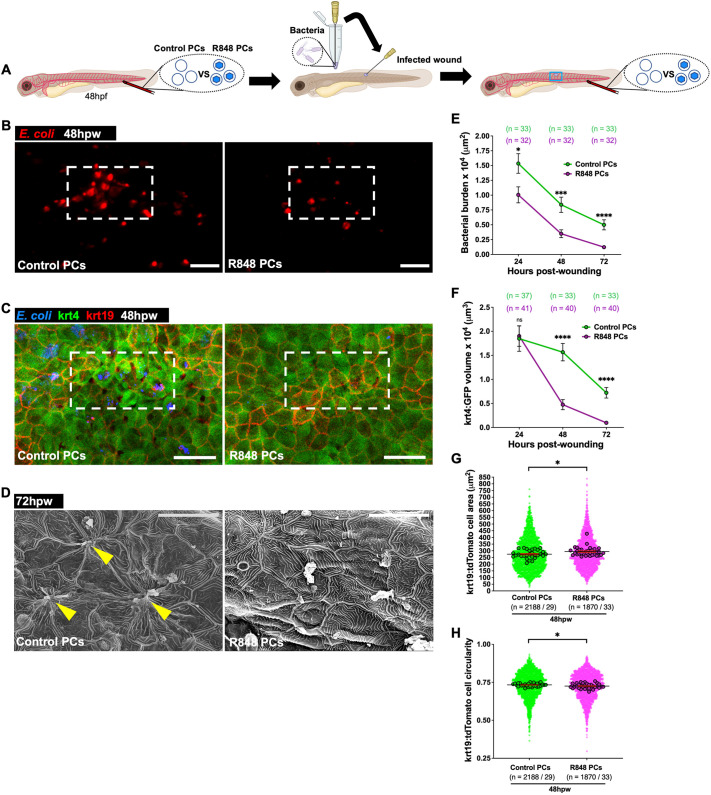
R848-protocell treatment enhances macrophage bactericidal activities and improves healing of infected wounds. (A) Schematic for experiments in B–H showing wounds, injection sites and imaging region (blue box). (B) Images of WT larvae with infected wounds showing bacteria (red) after each protocell treatment. (C) Confocal images of infected wounds of Tg(krt4:GFP;krt19:tdTomato-CAAX) larvae after each protocell treatment at 48 hpw. (D) SEM images of the same treatments at 72 hpw. (E–H) Graphs showing bacterial burden (E), high-fluorescence krt4–GFP volume (F) and krt19–tdTomato cell area (G) and circularity (H). White dashed boxes in B and C indicate wound sites; yellow arrowheads in D indicate wounded keratinocytes; each dot in E and F represents the mean of all fish analysed, and in G and H, each small dot represents one cell and larger dots are the mean from one fish. Error bars are mean±s.e.m. ns, not significant; *P<0.05; ***P<0.001; ****P<0.0001 (unpaired two-sided Mann–Whitney test). n, number of fish (E,F) or number of cells/number of fish (G,H). Scale bars: 100 μm (B), 50 μm (C), 20 μm (D).

