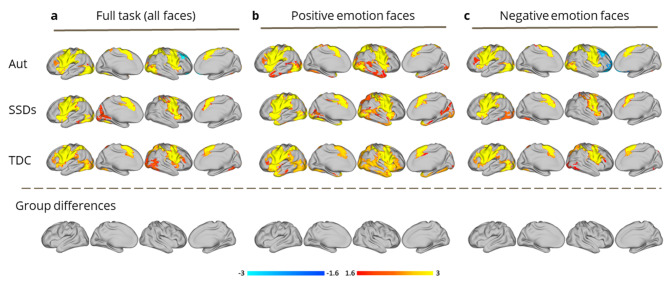
Fig. 2.
Group-level general linear model (GLM) analyses of Imitate/Observe (ImObs) task-fMRI data, conducted using FSL’s permutation analysis of linear models (PALM), for autism (Aut), schizophrenia spectrum disorders (SSDs), and typically developing control (TDC) groups. Main effects for each group are shown, according to analyses performed using: (a) all faces from the full ImObs task (n = 80); (b) positive emotion faces from the ImObs task (happy; n = 16); (c) negative emotion faces from the ImObs task (sad, angry, and fearful; n = 48). No significant group differences were detected

