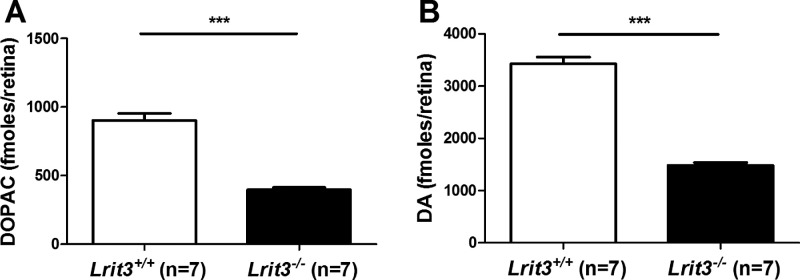
Figure 1.
Retinal levels of DA and DOPAC. Quantification of retinal levels of DOPAC (A) and DA (B) in 12 weeks old light adapted Lrit3+/+ and Lrit3−/− mice. Data are expressed as mean ± SEM. ns, not significant. ***P ˂ 0.001. This figure was published before in a review without describing the details.20 The authors obtained the permission to publish this figure herein.

