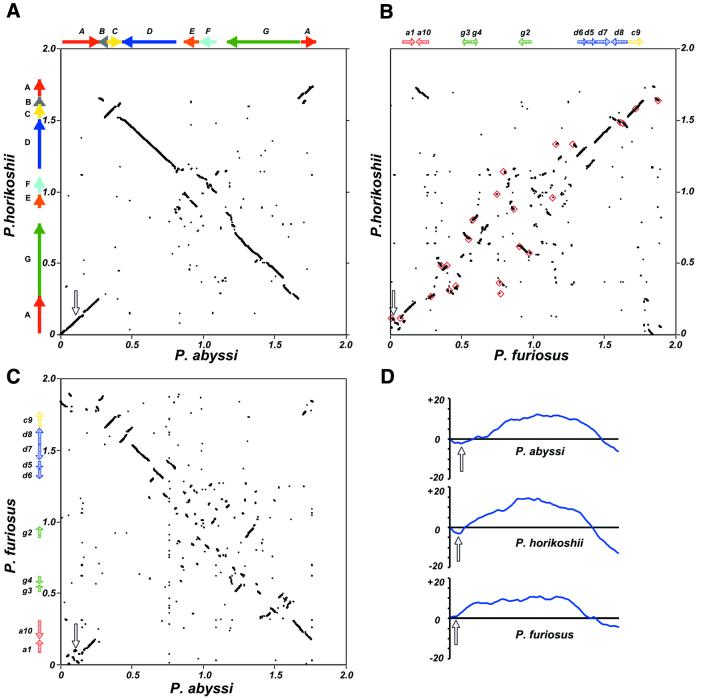
Figure 1.
Pyrococcus whole genome DNA alignments and GGTT word skew analysis. (A–C) Genome pairwise alignments as indicated besides and beneath the frames axes; each dot represents a 100 nt segment significantly matching in both genomes (see Materials and Methods). Plots of coordinate origins and sequence orientations are taken from the reference sequences. (A) Solid colored arrows indicate the large A to G synteny segments between P.horikoshii and P.abyssi and their relative orientation in each genome. (B and C) Shaded colored arrows represent the location and relative orientation of smaller segments conserved in all three genomes (a1, a10, g2–g4, d5–d8 and c9). (B) Red squares denote the locations of IS elements identified in P.furiosus. Scales are in Mb, open arrows indicate the location of oriC in each genome. (D) Cumulative GGTT skews were calculated for each Pyrococcus genome and plotted. The x-axis is the genome length, the y-axis represents the cumulative difference in arbitrary units. Open arrows indicate the location of oriC in each genome as in (A–C).

