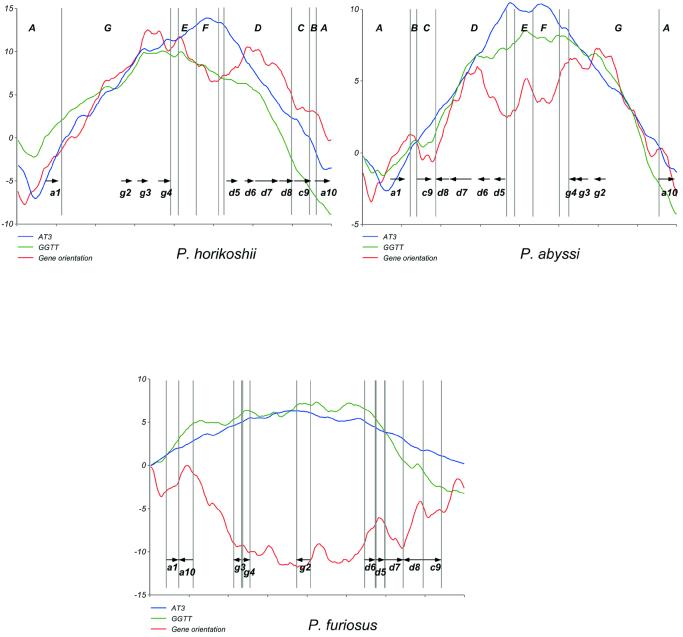
Figure 3.
Different cumulative skews for two Pyrococcus species. Skews are computed as described in Materials and Methods. The GGTT curve is given in arbitrary units, and gene orientation and AT3 skews are fitted on it for clarity, meaning that scale is not informative. Syntenic A to G and a, c, d, g segments from Figure 1 are delimited by vertical lines.

