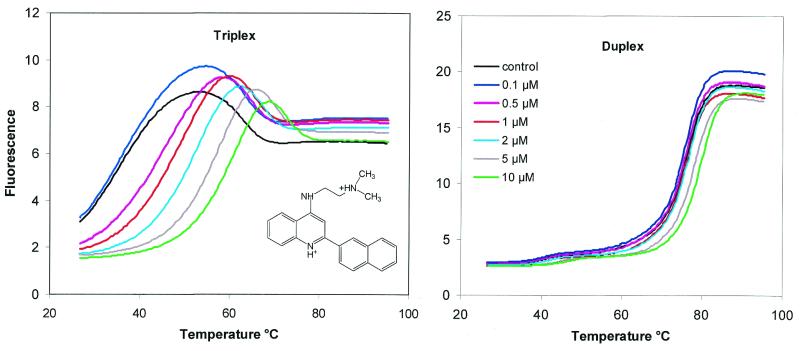
Figure 5.
The effect of the naphthylquinoline triplex-binding ligand (chemical structure shown in left panel) on the fluorescence melting curves for oligo 1 (right panel) and oligo 4 (left panel). The ligand concentration for each curve is shown in the inset. The fluorescence is expressed in arbitrary units.

