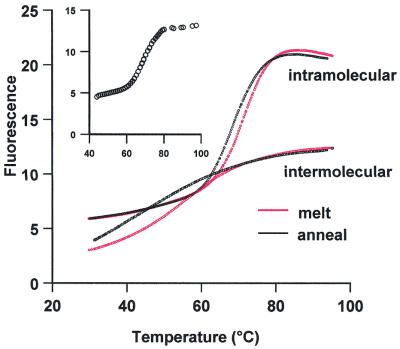
Figure 6.
Fluorescence melting curves for the intramolecular quadruplex formed by oligo 11 and the intermolecular quadruplex formed by oligo 12. Annealing curves are shown in black, while melting curves are shown in red. The insert shows the annealing curve obtained when the complex was left to equilibrate for 10 min after each 1°C decrease in temperature, before recording the fluorescence. The fluorescence is expressed in arbitrary units.

