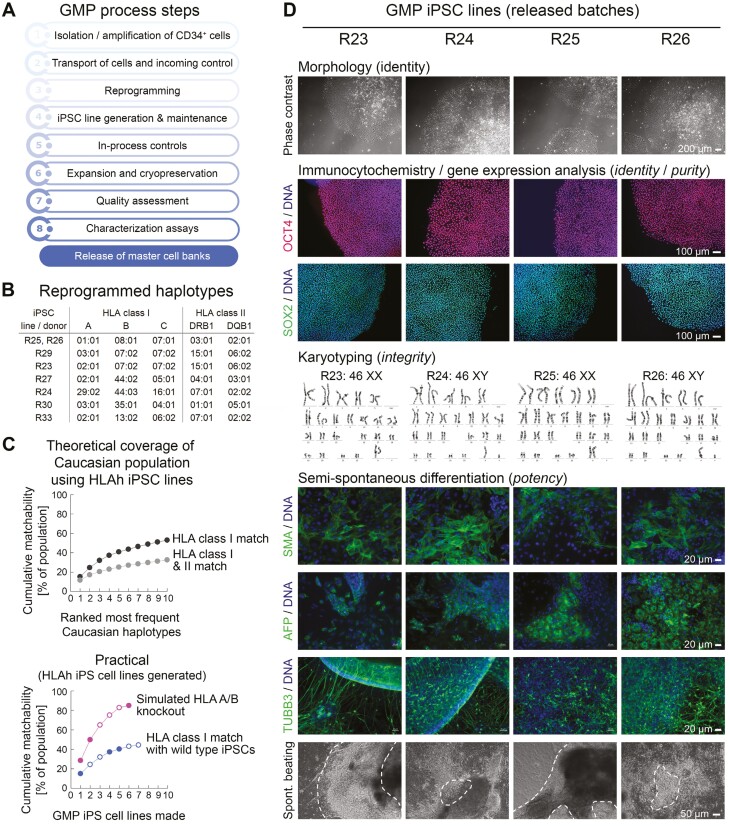
Figure 1.
Reprogramming process and iPSC characterization. (A) Flowchart of iPSC manufacturing process with QC. (B) Top 7 most frequent Caucasian HLA haplotypes accessible for reprogramming from homozygous donors. R25 and R26 are iPSC lines derived from distinct individuals. (C) Probabilities of identifying matching patients with a given set of HLA-homozygous iPSC lines in the Caucasian population. Open circles in the bottom chart: reprogrammed iPSC lines with pending QC. Filled circles in same chart: released iPSC lines. Two released lines share the same (most frequent) HLA haplotype. (D) Exemplary characterization data of 4 reprogrammed iPSC lines showing the indicated features and markers.

