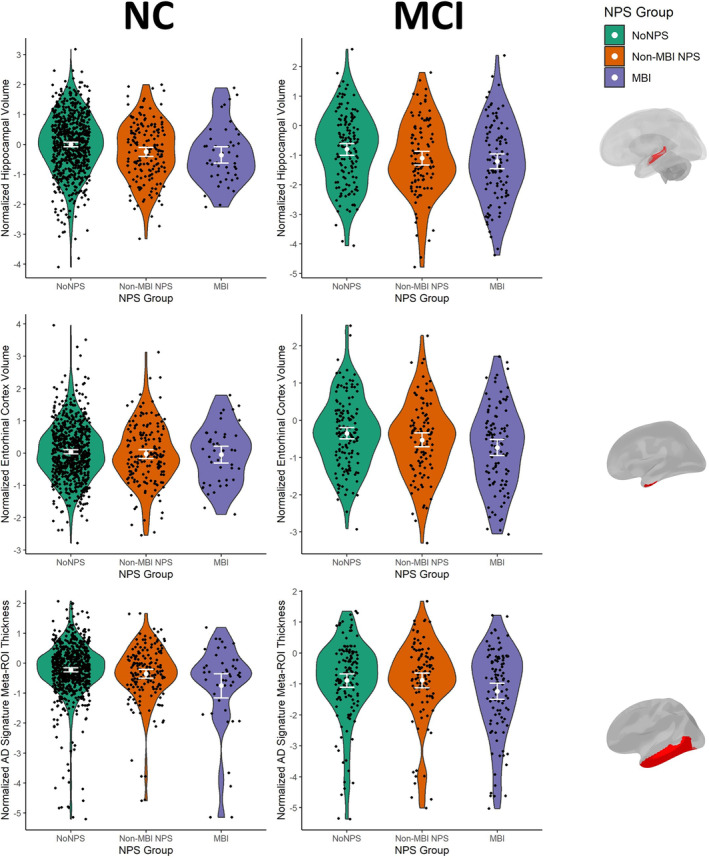
FIGURE 2.

Violin plots of AD structural neuroimaging biomarkers as a function of NPS group. White dots indicate group means and error bars indicate 95% confidence intervals. Brain figures on the right show the anatomical location of the corresponding regions of interest. Although only one hemisphere is shown, bilateral measures were used for analysis. The AD signature meta‐ROI consisted of the entorhinal cortex, inferior temporal gyrus, middle temporal gyrus, and fusiform gyrus. AD, Alzheimer's disease; MBI, mild behavioral impairment; MCI, mild cognitive impairment; NC, normal cognition; NPS, neuropsychiatric symptoms; ROI, region of interest.
