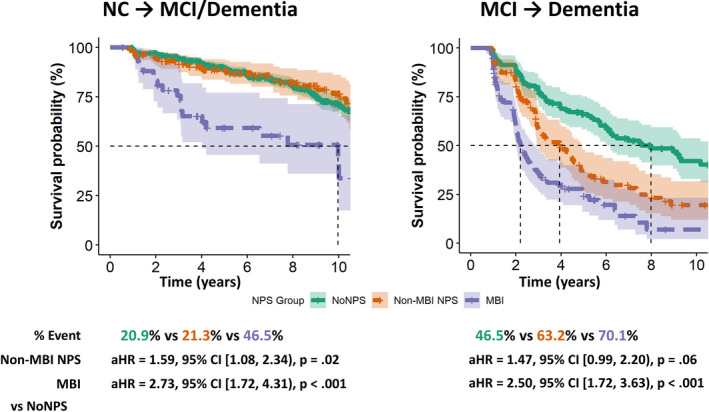
FIGURE 3.

Survival analyses of incident mild cognitive impairment and/or dementia as a function of NPS group. Dashed lines in the Kaplan–Meier survival curves indicate median time to event. Hazard ratios shown below the Kaplan–Meier survival curves were derived from Cox proportional hazard regression models adjusting for age, sex, years of education completed, participant race/ethnicity, time elapsed between clinical and scanning visits, and the number of APOE4 alleles, baseline volumes of the bilateral hippocampal and entorhinal cortex, and the mean cortical thickness of the AD meta‐ROI. 95% CI, 95% confidence interval; AD, Alzheimer's disease; aHR, adjusted hazard ratio; APOE4, apolipoprotein E e4; MBI, mild behavioral impairment; MCI, mild cognitive impairment; NC, normal cognition; NPS, neuropsychiatric symptoms; ROI, region of interest.
