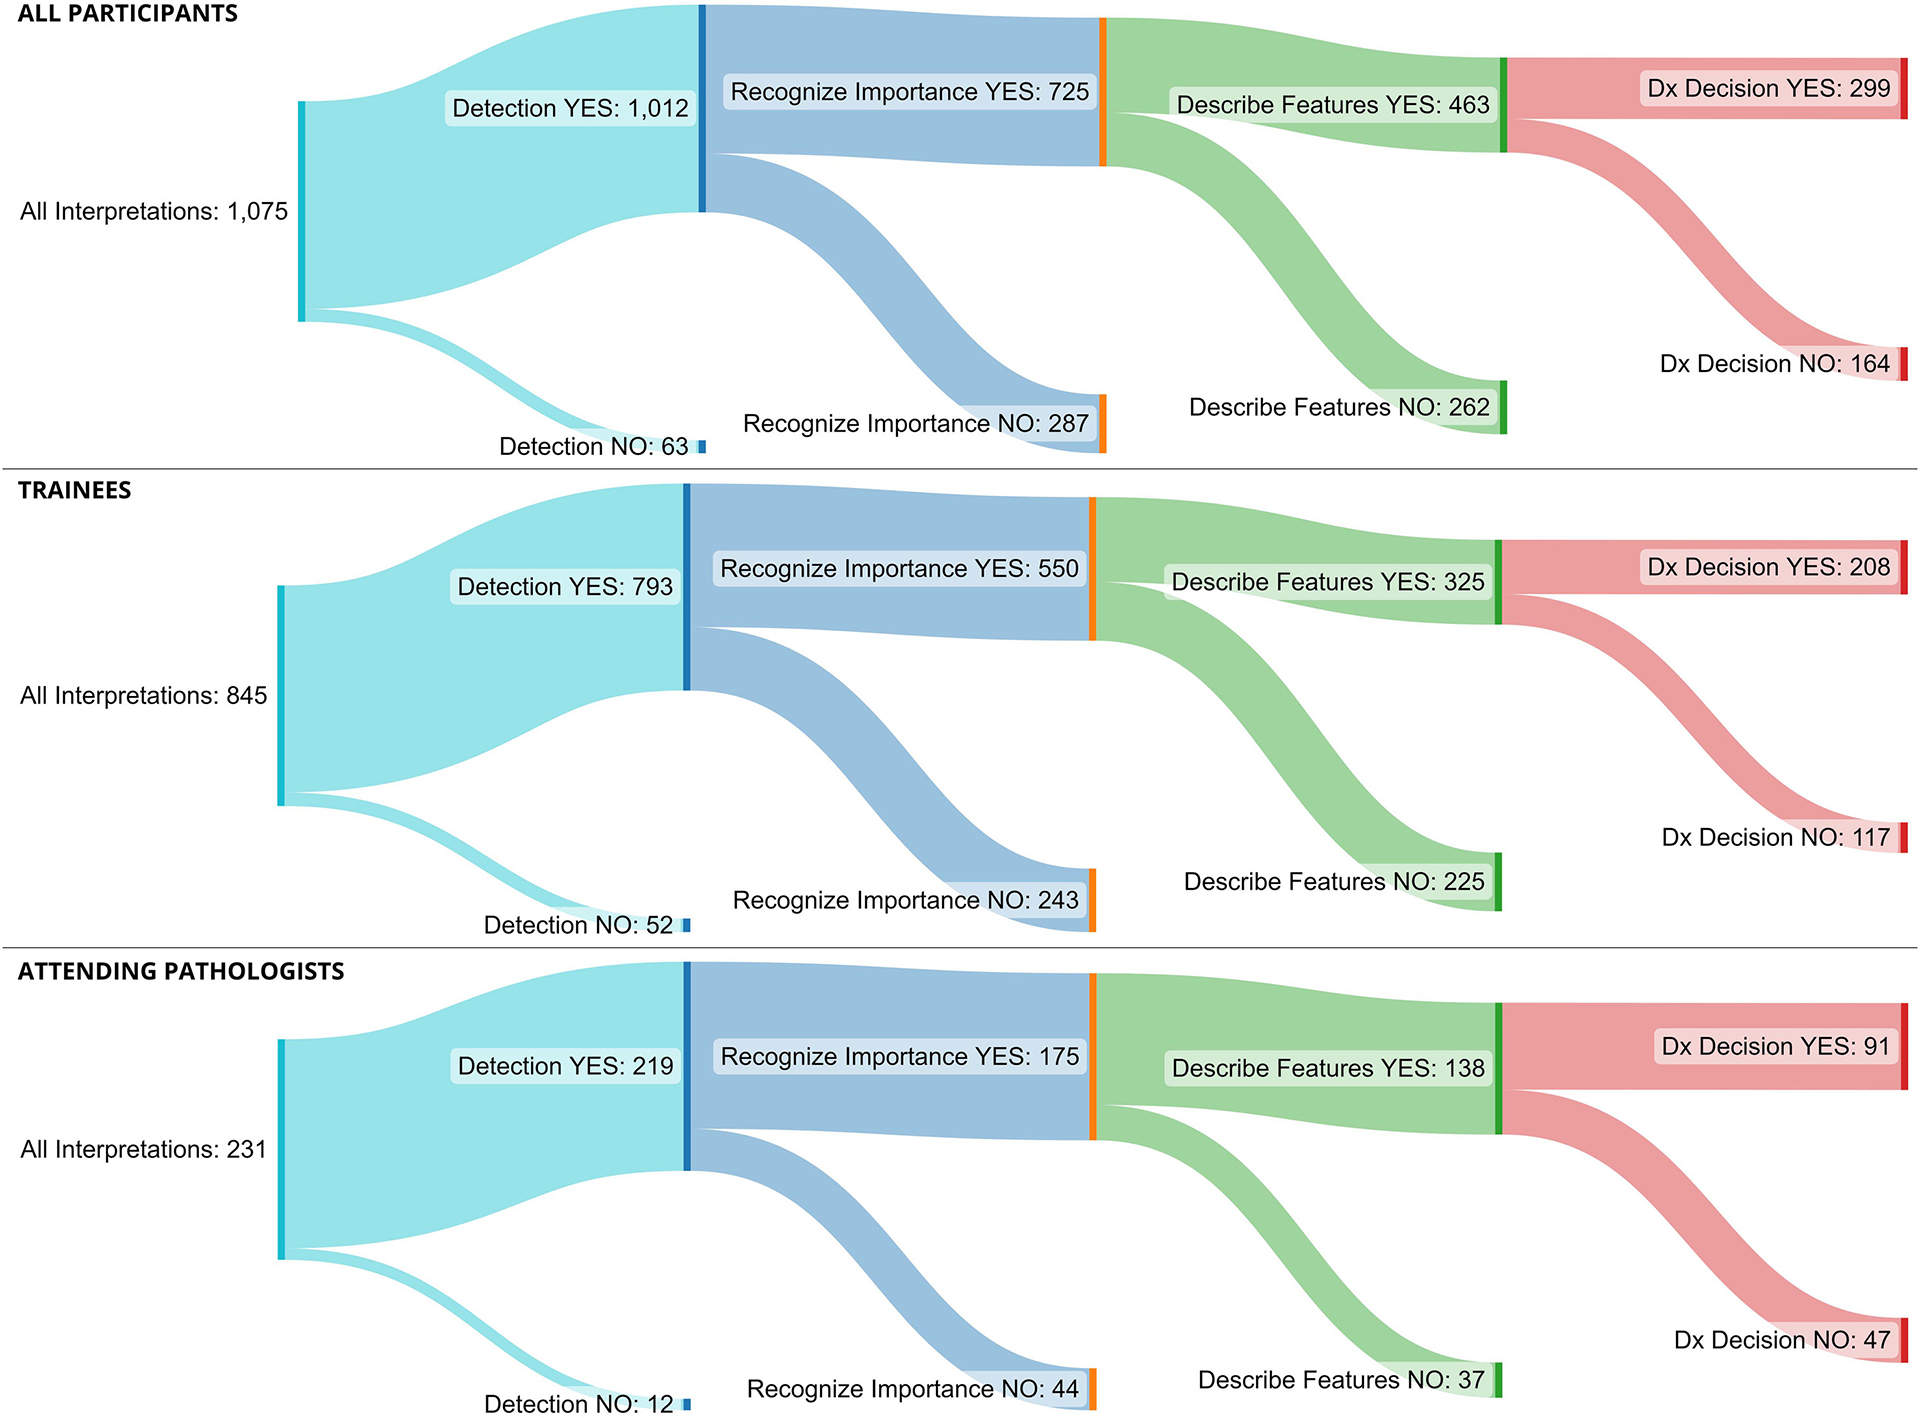
Figure 3.

Sankey diagrams showing the flow of the interpretive process through the four interpretive phases: detecting the lesion, recognizing importance, describing features, and diagnostic decision. The width of a flow is proportional to its quantity (i.e., the number of interpretations), branches represent change in flow (e.g., detecting or not detecting a cROI), and colors represent phases (e.g., detection, recognition). Upper image displays all participants, middle displays pathology trainees, and lower displays attending pathologists.
