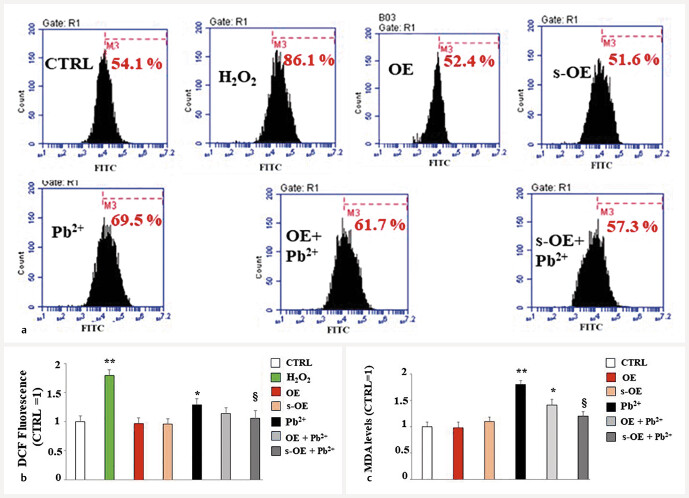
Fig. 5.
ROS accumulation and malondialdehyde levels. In panel a , the accumulation of ROS measured with the cytofluorometer is shown. Each box refers to a treatment as indicated: the x-axis represents the fluorescence of the fluorochrome Fitc connected to our fluorescent probe, while the y-axis is relative to the number of cells that we decided to acquire (10 000). At the top of each box, there is a marker (M3), which is arbitrarily drawn in the control and kept the same for all other samples. The part of the peak included in M3 is indicated by a numerical percentage. In panel b , the respective quantification, obtained from comparing the percentages, is represented. The control percentage is arbitrarily made equal to 1 and the other values are related to it. Panel c represents the levels of malondialdehyde generated by the different treatments. Three independent experiments were carried out, and the values are expressed as the mean ± standard deviation (sd). * denotes p < 0.05 vs. CTRL; ** denotes p < 0.01 vs. CTRL; § denotes p < 0.05 vs. lead. Analysis of variance (ANOVA) was followed by a Tukey–Kramer comparison test.

