
Figure 4.
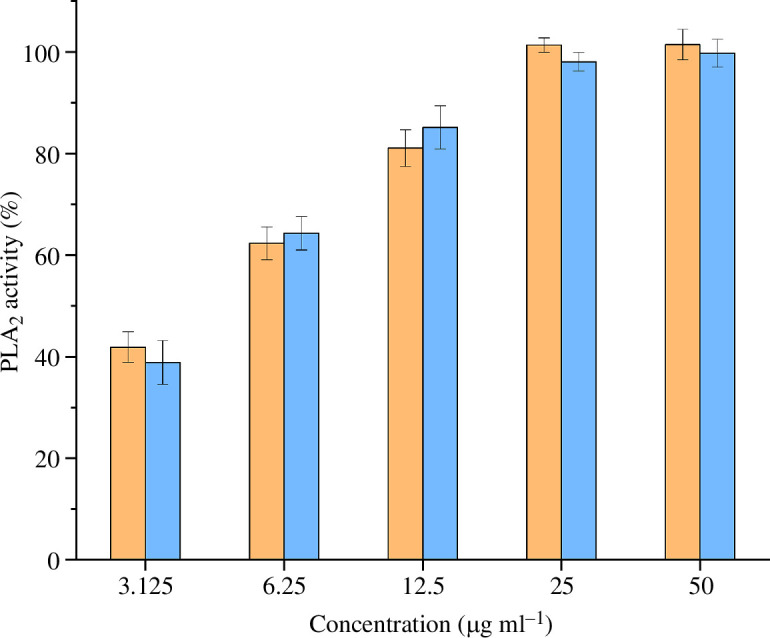
Phospholipase A2 (PLA2) activity of the two Vipera berus venoms. Venoms from melanistic and cryptic specimens are represented in orange and blue, respectively. The graph represents the normalized (positive control: bee venom PLA2, 100%; negative control: buffer, 0%) results of the five concentrations tested (i.e. 3.125, 6.25, 12.5, 25 and 50 µg ml−1). Data are means ± s.d. of technical replicates (n = 3).