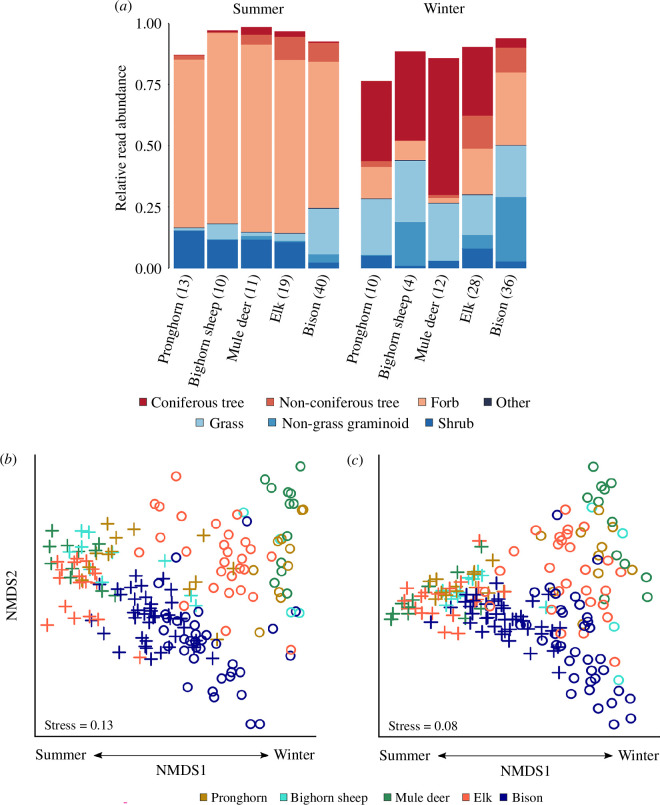
Figure 3.
Dietary composition and niche partitioning of five large-herbivore species in Yellowstone National Park. (a) Stacked bars represent the proportion of each species’ diet profile that we assigned to each of seven functional groupings in summer versus winter (electronic supplementary material, appendix S3; dataset S4). At least 84% of 685 taxa in the dataset could be classified into the seven functional groups according to the USDA Plants Database (‘other’ category includes taxa that are from the family Equisetaceae and non-vascular mosses). Sample size for each species in each season are shown in parentheses. Strong dietary shifts occurred between winter (open circles, right) and summer (plus symbol, left) in (b) plant taxonomic composition and (c) functional plant type composition as visualized using NMDS and the Bray–Curtis dissimilarity metric (analyses included the ‘undetermined’ functional group). Taxonomic composition of diets differed significantly according to species (perMANOVA; pseudo-F 4,174 = 9.4, R2 = 0.14, p ≤ 0.001), season (pseudo-F 1,174 = 37.4, R2 = 0.14, p ≤ 0.001), and the species × season interaction (pseudo-F 4,174 = 6.4, R2 = 0.09, p ≤ 0.001), as did the composition of plant functional types (species: pseudo-F4,173 = 11.6, R2 = 0.13, p ≤ 0.001; season: pseudo-F1,173 = 110.2, R2 = 0.30, p ≤ 0.001; species × season interaction: pseudo-F 4,173 = 8.4, R2 = 0.09, p ≤ 0.001).

