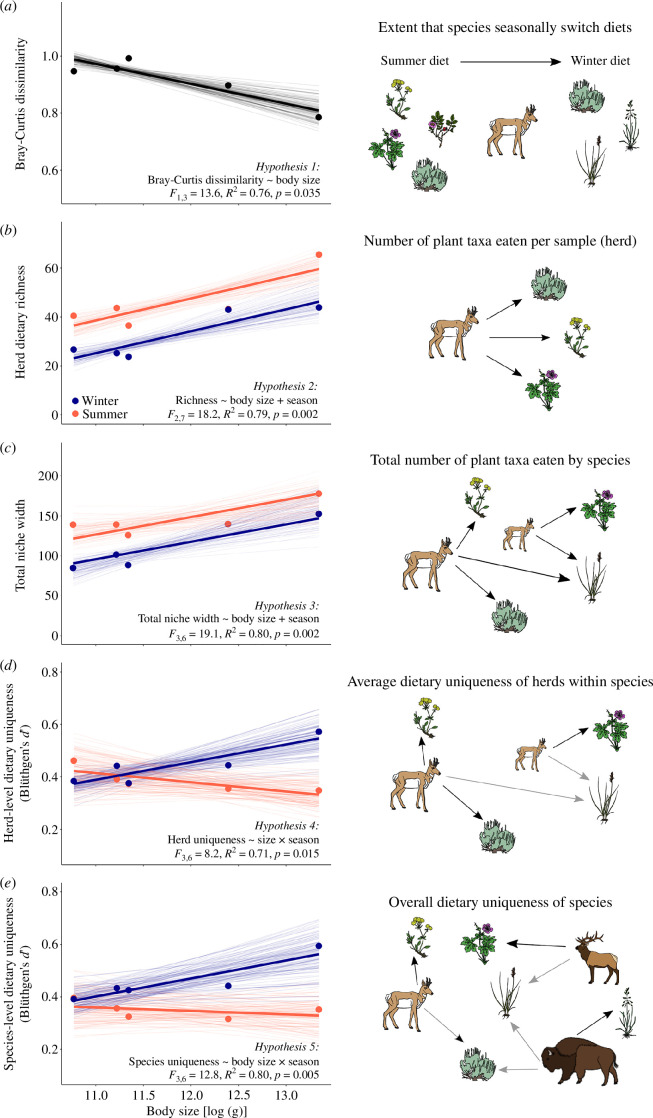
Figure 4.
Seasonal diet changes at levels spanning herds, species and communities. (a) All species switched diets seasonally, but the extent of switching decreased with body size. (b) On average, herds of larger species consumed more taxa and all herds increased dietary richness in summer. (c) Total niche width was greater in summer for most species and larger species consumed more plant taxa overall. (d) Herd-level and (e) species-level dietary uniqueness changed seasonally in ways that were contingent on body size: larger species strongly increased dietary uniqueness while smaller species exhibited similar or even decreased dietary uniqueness in winter. Bray–Curtis dissimilarity and Blüthgen’s d′ are bounded between 0 (no turnover/specialization) to 1 (complete turnover/specialization). In all panels, thin lines indicate regressions for each of the 100 random subsamples and the thick line indicates the regression line for the best-fitting model of the mean values per species (large points).

