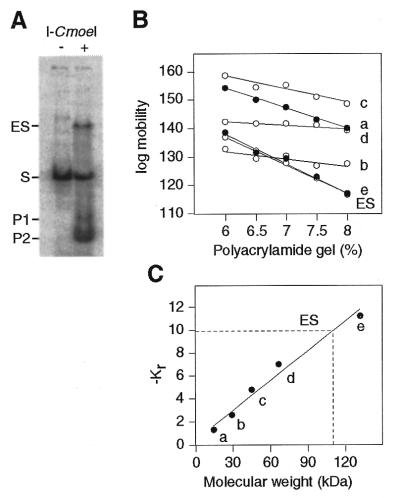
Figure 6.
Stoichiometry of the rI-CmoeI–homing site interaction. (A) Analysis of the rI-CmoeI–DNA complex (ES) in polyacrylamide gels. rI-CmoeI was incubated in the presence of a 33P-end-labeled DNA substrate (104 bp) containing the CmpsbA·1 homing site and the mixture was electrophoresed in gels containing 6.0, 6.5, 7.0, 7.5 and 8.0% polyacrylamide. After staining with Coomassie blue, the gels were exposed to a phosphorimaging plate. The image of the 6.0% polyacrylamide gel is shown. (B) Mobility of the ES and protein standards as a function of polyacrylamide concentration. a, α-lactalbumin (14.2 kDa); b, carbonic anhydrase (29.0 kDa); c, chicken egg albumin (45.0 kDa); d and e, bovine serum albumin monomer (66.0 kDa) and dimer (132.0 kDa), respectively. (C) Plot of –Kr values of protein standards as a function of molecular weight. Interpolation of the –Kr value of the ES reveals a molecular weight of 110 kDa.

