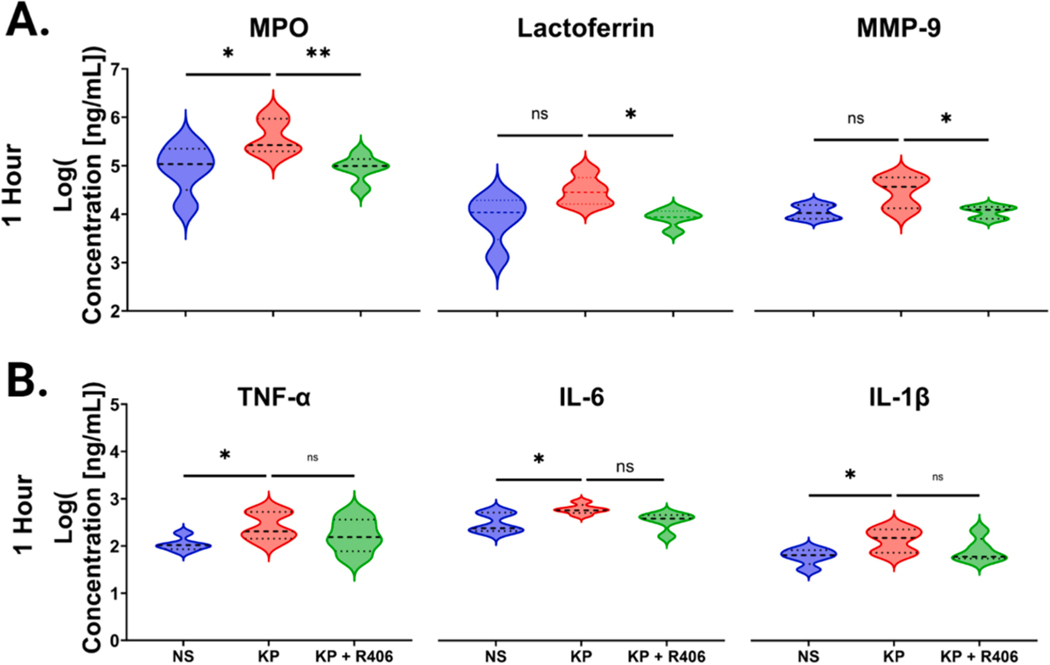
Fig. 2. R406 decreases neutrophil degranulation while having no effect on cytokine release.
(A) Volcano plots showcasing the levels of neutrophil degranulation markers, MPO, lactoferrin, and MMP9 were measured in the cell supernatant one hour post stimulation in non-stimulated cells, cell stimulated with 1 μg/mL of K. pneumoniae LPS, and cells stimulated with 1 μg/mL of K. pneumoniae LPS plus 1 μM R406. Dotted lines represent the median as well as 25th and 75th quartile for each analyte. P values were computed using one-way ANOVA for all comparison. (B) Volcano plots showcasing the concentration of soluble TNF-α, IL6, and IL-1β in the supernatant 1 h post stimulation in the same groups as (A).

