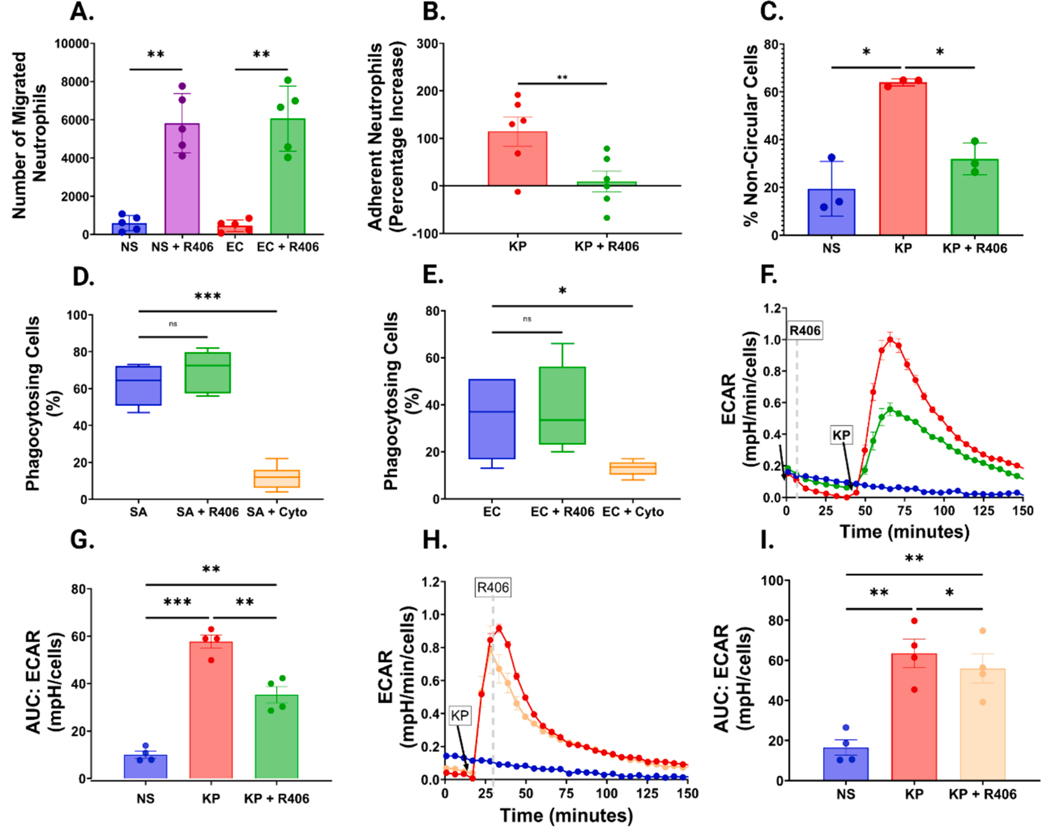
Fig. 4. R406 has diverse effects on neutrophil migration, adhesion, shape, phagocytosis, and metabolism.
(A) Bar graph showing the number of neutrophils migrating over one-hour in response to IL-8. Neutrophils were either not stimulated (NS) or exposed to 10 ng/mL E. coli (EC) LPS, with or without preincubation with 1 μM R406. All P values were computed by one-way ANOVA as previously described. (B) Bar graph comparing the percentage increase of neutrophils adhered to HUVEC cells relative to non-stimulated cells in cells stimulated with 100 ng/mL of K. pneumoniae LPS with or without preincubation with 1 μM R406. (C) Bar graph showcasing the percentage of non-circular cells, in non-stim cells (NS), and cells stimulated with 1 μg/mL K. pneumoniae LPS with or without R406. (D) Box and whisker graph showcasing the percentage of total cells undergoing phagocytosis Cells were either incubated with 1 μg of pHrodo® Green Staphylococcus aureus (SA) bioparticles either with (SA+R406) or without (SA) preincubation with 1 μM R406 or 10 μg/mL of Cytochalasin D (SA+Cyto), Boxes show mean value as well as 25th and 75th percentile of data. Whiskers represent minimum and maximum of each data set. (E) Box and whisker plot showing percentage of cells undergoing phagocytosis as shown in (D), but neutrophils were plated with 1 μg of pHrodo® Green E. coli bioparticles. (F) Representative kinetic graph showcasing the increase in the extracellular acidification rate of the media surrounding neutrophils as measured by the Agilent Seahorse in cells stimulated with 5 μg/mL of K. pneumoniae LPS (red line) relative to cells stimulated with the same concentration of LPS plus 1 μM R406 (green line) and a control non-stimulated cells (blue line). (G) AUC of extracellular acidification rate of the conditions outlined in (F). (H) Representative kinetic graph showcasing the increase in the extracellular acidification rate of the media as described in (F), with the yellow line representing cells stimulated with 5 μg/mL of K. pneumoniae LPS followed by 1 μM R406 exposure 10 min post stimulation. (I) AUC of extracellular acidification rate of the conditions outlined in (H).

