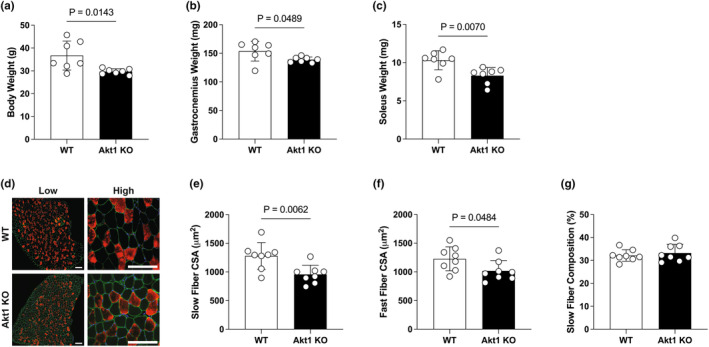
FIGURE 1.

Decreased body weight and muscle fiber size in Akt1 KO mice. (a) Body weight (g). Wet weight (mg) of (b) gastrocnemius muscle, and (c) soleus muscle. n = 7 in each group for body weight and muscle weight. (d) Representative immunostaining images of soleus muscle cross‐sections (Blue; 4′,6‐diamidino‐2‐phenylindole, Green; laminin, Red; slow‐myosin heavy chain). Negatively‐stained black fibers were designated as fast‐type fibers. The scale bar shows 100 μm. The mean size of cross‐sectional area in (e) slow‐type and (f) fast‐type fibers. (g) Composition (%) of slow‐type fibers was calculated by counting a total of 200–300 fibers from different regions in each sample. n = 8 in each group for muscle fiber size analysis. All results were expressed as mean ± SD. The p‐values are indicated directly in the figure for significant difference.
