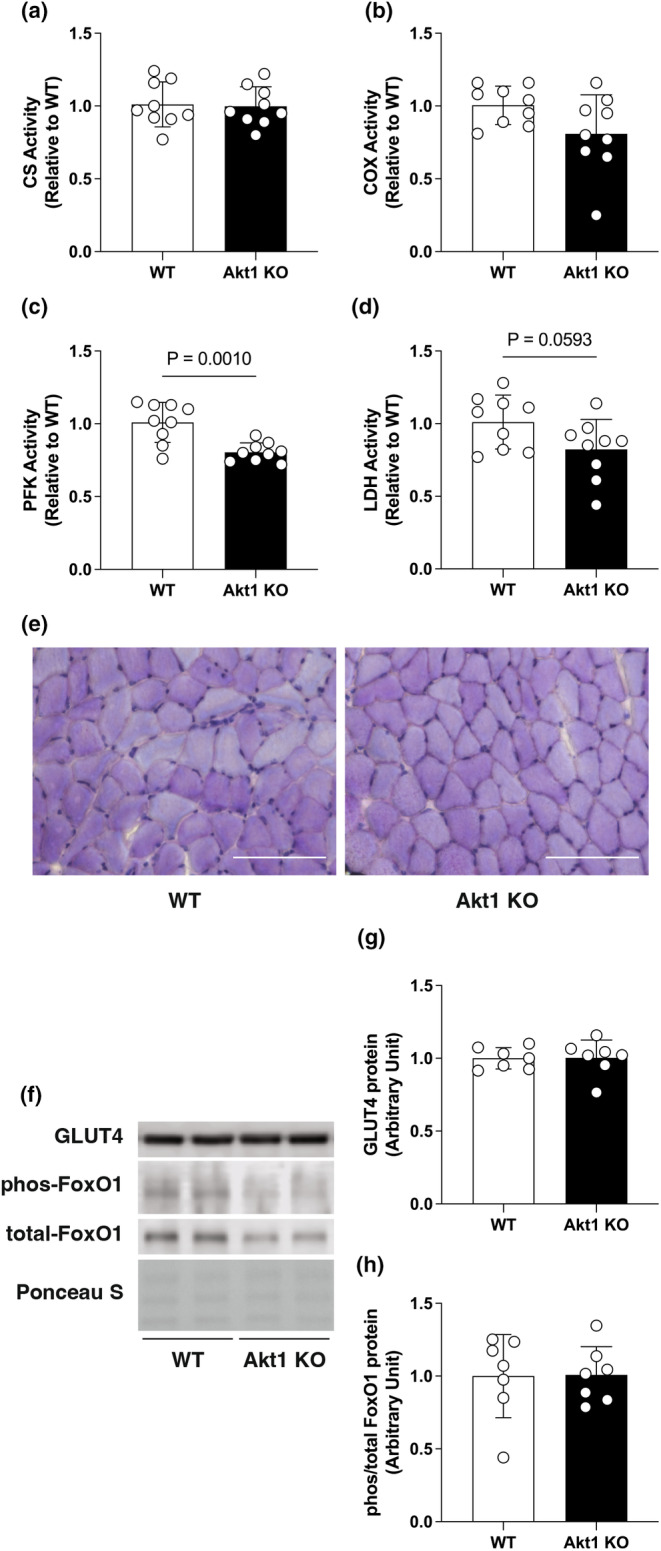
FIGURE 4.

Decreased glycolytic enzyme activity in the soleus muscle of Akt1 KO mice. Oxidative or glycolytic enzyme activities of (a) citrate synthase, (b) cytochrome c oxidase, (c) phosphofructokinase, and (d) lactate dehydrogenase was determined. n = 9 in each group for enzyme activity assays. (e) Representative histological images of soleus muscle cross‐sections with PAS staining. The scale bar shows 100 μm. (f) Representative image of Western blotting and quantification for (g) glucose transporter type 4, and (h) forkhead box O 1 (FoxO1) in the soleus muscle of WT and Akt1 KO mice. Equal amounts of protein loading were confirmed by Ponceau S staining. Phosphorylation level of FoxO1 protein was expressed as relative to total protein. n = 7 in each group for Western blotting. All results were expressed as mean ± SD. The p‐values are indicated directly in the figure.
