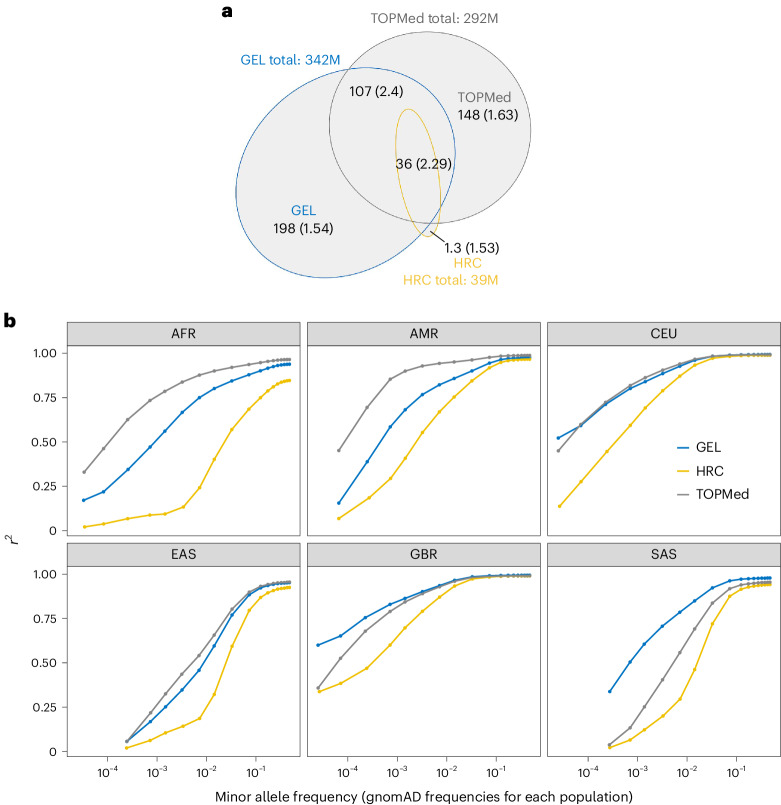
Fig. 1. The GEL reference panel variant count and imputation accuracy.
a, Venn diagram comparing numbers of variants from the GEL, HRC and TOPMed r2 reference panels. The numbers show the variant count (in millions of variants, M), followed by the Ts/Tv ratio of these variants in brackets. b, Imputation performance, measured by r2 (Methods), for imputation of 1000 Genomes Project samples with African (AFR), American (AMR), East Asian (EAS), British (GBR), North European (CEU) and South Asian (SAS) populations, using three different reference panels (labels). The variants are stratified by gnomAD allele frequency (v.3.3.1)4 of their corresponding population.

