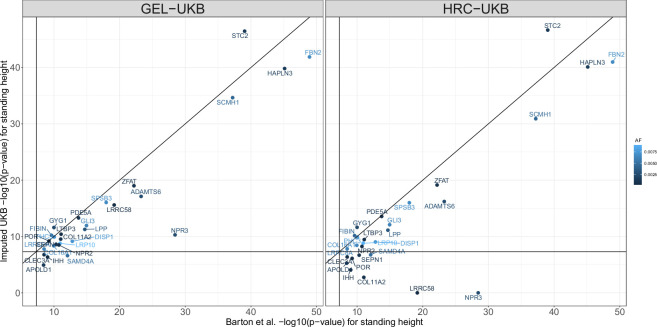
Extended Data Fig. 8. Comparing the P-values of GEL-UKB and HRC-UKB with rare likely causal coding variants identified by whole exome imputation.
The x-axis shows the P-value using whole exome imputation9, and the y-axis shows the P-value using GEL-UKB (left) and HRC-UKB (right). The −log P-value is set to be 0 when the variant is not found. The dots are colors according to their allele frequency from the exome imputation data. The horizontal and vertical lines show the genome-wide significant threshold, that is 5 × 10⁻⁸.

