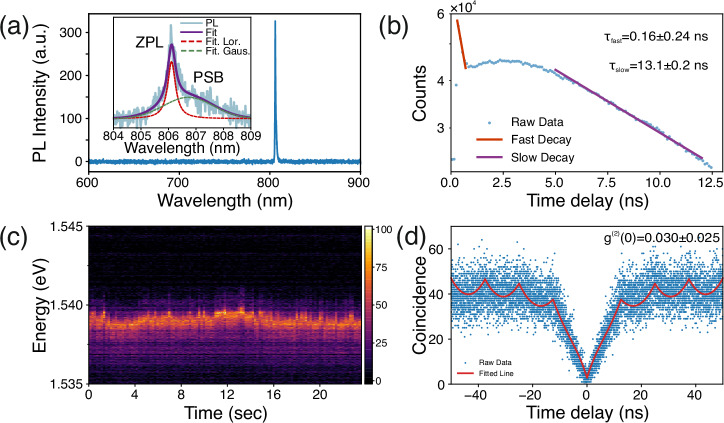
Fig. 5. Single-photon characterization.
a PL spectrum (4 K) taken from an exemplary single localized quantum emitter with high-degree polarization of 92 ± 12% under the above-band excitation of 532 nm femtosecond pulsed laser (80 MHz). The inset shows a high-resolution PL spectrum with a pronounced zero-phonon line (ZPL) and a low-energy broader phonon-side band. The fitting results exhibit the ZPL located at 806.1 nm, with a linewidth of 0.35 ± 0.08 nm. The broader PSB with a linewidth of 0.91 ± 0.04 nm is red-detuned by 0.6 nm to the ZPL, resulting in an asymmetric PL emission spectrum. b Semi-logarithmic plot of the lifetime measurement of the WSe2 quantum emitter fitted with a biexponential function, resulting in a lifetime of τfast = 0.16 ± 0.24 ns and τslow = 13.3 ± 0.2 ns. c Time trace of PL emission signal, recorded using a high-resolution spectrometer with an integration time of 0.2 s per frame. The time trace data reveals a maximum wobbling span of approximately 1 meV for the ZPL. Fitting the distribution of the energy of the maxima for each line in the spectral map gives an average central position of the peak at 1.5365 eV with a standard deviation of 0.267 meV. d Corresponding second-order autocorrelation measurement (g(2)(τ)) of the emitter under the pulsed above band excitation, revealing an antibunching value of g(2)(0) = 0.030 ± 0.025.

