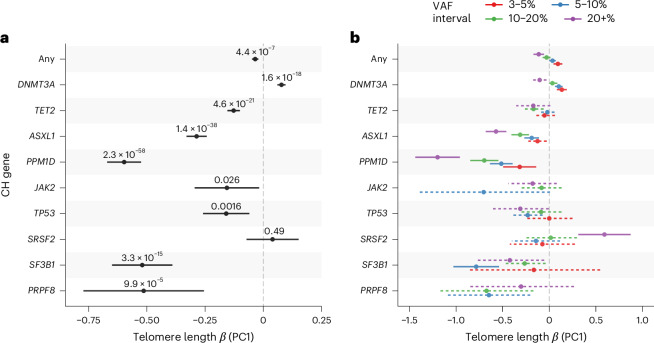
Fig. 3. Associations between telomere length and CH.
a, Collapsing analysis of somatic variants in select CH genes with telomere length PC1 metric. b, Collapsing analysis of somatic variants in CH genes stratified by VAF intervals (colors). Associations not reaching significance are shown with dashed error bars. In both plots, ‘Any’ indicates an overall analysis of the selected CH genes and estimates and 95% CIs (error bars) and P values (two-sided, unadjusted) are derived from fitting a linear model across 388,111 independent samples of broad NFE genetic ancestry.

