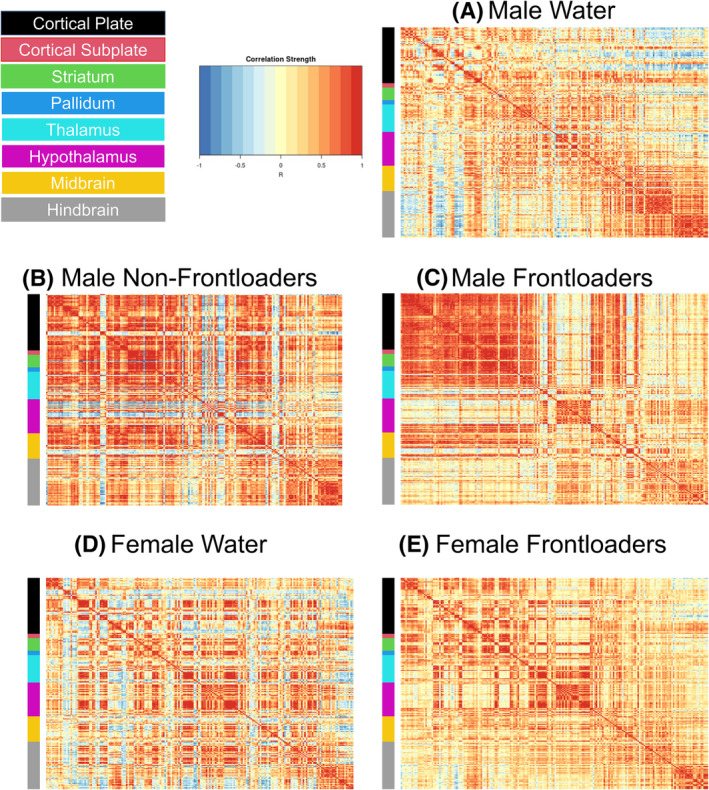
FIGURE 2.

Functional correlation matrices organized using the Allen Brain Atlas. Males (A–C) and females (D, E) are represented. Note that there is no non‐frontloading group represented for females as there were only two female mice who did not frontload when brains were extracted on Day 8, which inhibits the ability to make meaningful conclusions about female non‐frontloaders in the current study.
