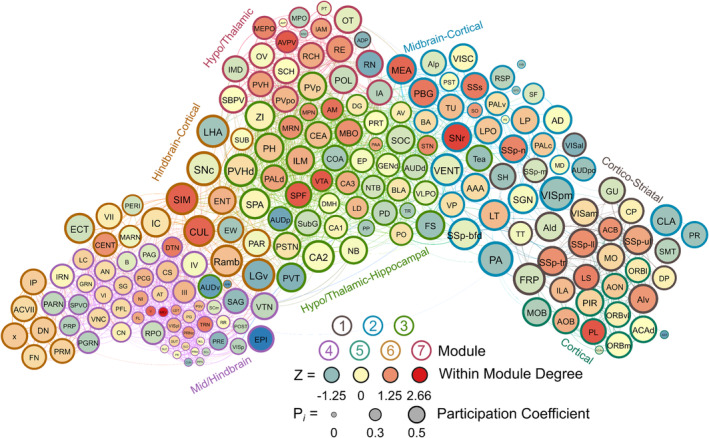
FIGURE 5.

A visualized network of functional connectivity in male water drinkers. Each brain region is a circle. The size of the circle represents the participation coefficient. The colour inside the circle represents the WMDz. The colour on the outside of the circle represents the module. Seven distinct modules were identified using hierarchical clustering (Figure 4A) and each is represented by a different colour.
