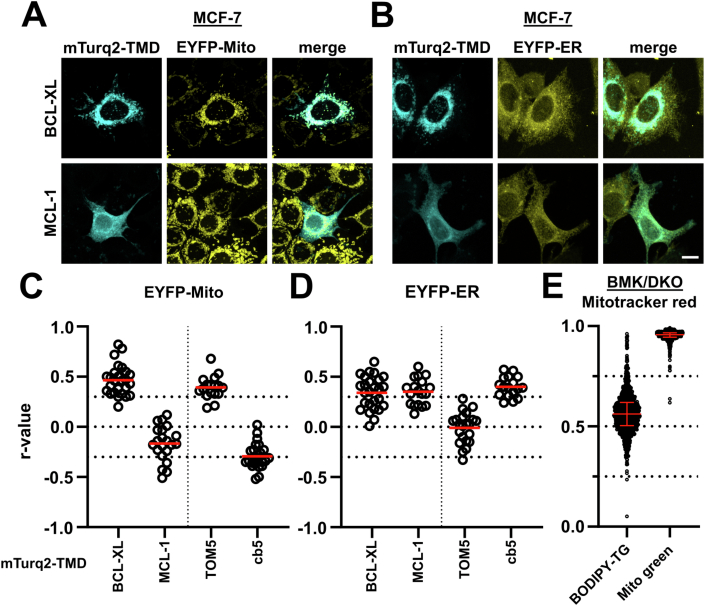
Figure EV2. (belonging to Fig. 2): BCL-2-TMD and BOK TMD are predominantly ER-localized.
(A, B) Subcellular localization of MCL-1-TMD and BCL-XL-TMD. MCF-7 cells expressing (A) EYFP-Mito or (B) EYFP-ER were transfected with plasmids for the expression of mTurquoise2 (mTurq2)-labeled BCL-XL-TMD or MCL-1-TMD and 24 h post transfection cells were imaged by cLSM. Images are maximum projections of representative z-stacks from three independent experiments. Scale bar = 10 µm. (C, D) Quantitative analysis of mTurquoise2-fused BCL-XL-TMD or MCL-1-TMD co-localization with (C) EYFP-labeled mitochondria and (D) EYFP-labeled ER from cLSM images (A, B). Graphs show Pearson’s r correlation coefficient for a total of ≥15 cells combined from three independent experiments. The mean is marked as a red horizontal line. Data for mTurquoise-TOM5-TMD and mTurquoise2-cb5-TMD are shown for comparison. (E) Co-localization analysis of subcellular markers in BMK/DKO cells. BMK/DKO cells labeled with DRAQ5 (nuclei) and Mitotracker red were stained with BODIPY-Thapsigargin (BODIPY-TG, ER control) or Mitotracker green (Mito control). Images of n ≥ 1000 cells were acquired using an Opera Phenix spinning disk system, images were analyzed and Pearson’s r calculated. Shown in red are the median + IQR.

