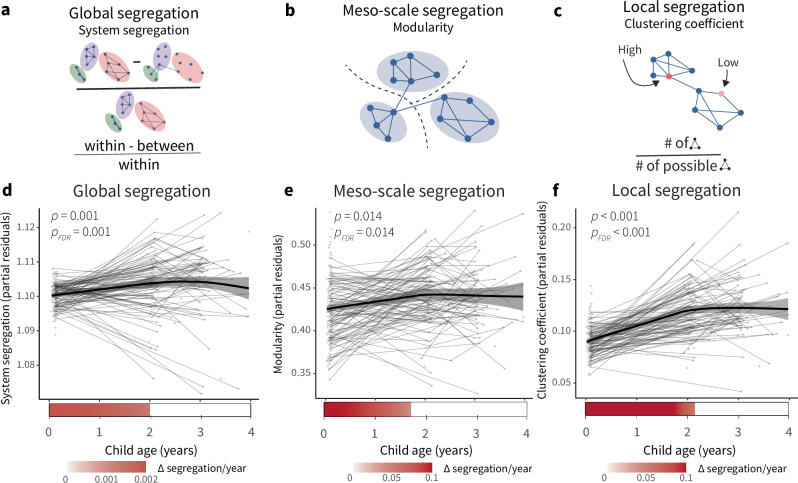
Fig. 1. Cortical network segregation increases with age during the first three years of life.
a System segregation is a whole-brain measure of functional network segregation that quantifies the difference between mean within-system connectivity and mean between-system connectivity as a proportion of mean within-system connectivity. b Modularity is a measure of network segregation that estimates the extent to which the nodes of a network, or in this case brain regions, can be subdivided into modules characterized by strong, dense intramodular connectivity and weak, sparse intermodular connectivity. Note that the modules are data driven, not a priori defined as functional systems. c The clustering coefficient is a measure of local segregation that quantifies the amount of connectivity between a node and its neighbors. A node has a high clustering coefficient when a high proportion of its neighbors are also strongly connected to one another. In a weighted network, the clustering coefficient measures the strength of triangles around a node. d Global segregation increases significantly with age. e Meso-scale segregation increases significantly with age. f Local segregation increases significantly with age. Individual points represent individual scans, with lines indicating scans from the same participant. Analyses in (d–f) conducted using generalized additive mixed models (GAMMs), P values are FDR-corrected across models for changes in measures of cortical network architecture with age (Figs. 1d–f and 6b). Trajectories represent the GAMM-predicted segregation values with a 95% credible interval band. Bars below the x-axis depict the derivative of the fitted smooth function of age. The filled portion of the bar indicates periods where the magnitude of the derivative of the fitted curve is significant, with the saturation of the fill representing the value of the derivative. Panels a–c reprinted with permission from ref. 7.

