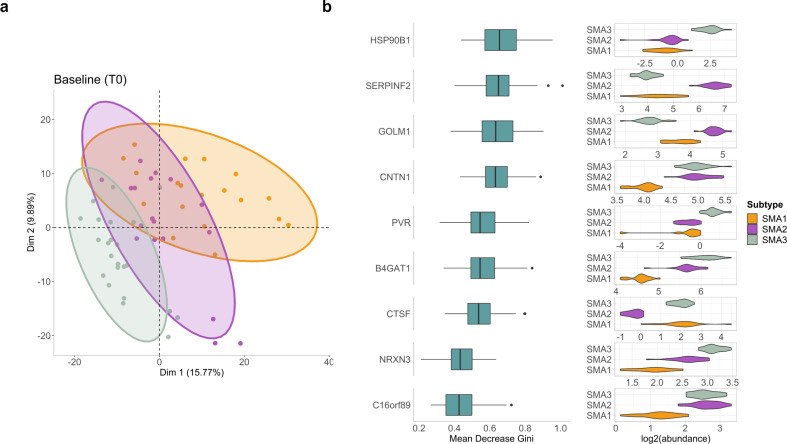
Fig. 2.
Random Forest identified new putative biomarkers for SMA severity. (a) PCA plot showing the separate clustering patterns of SMA1 (orange), SMA2 (purple) and SMA3 (green) proteomic profiles at T0 based on dimensions 1 and 2. On PCA plots, each sample was shown by points, and ellipses correspond to 95% confidence intervals for each of the subtypes. (b) Nine proteins common among top 30 features obtained from 100 different Random Forest models for classification of SMA types at T0. On the left side of figure, the importance score (based on mean decrease in Gini index) distributions of each protein from 100 models were illustrated by box plots. Log2 abundance of each protein in each SMA type at T0 were shown by violin plots on the right side. Box plots showing interquartile range, and outliers were shown by black dots

