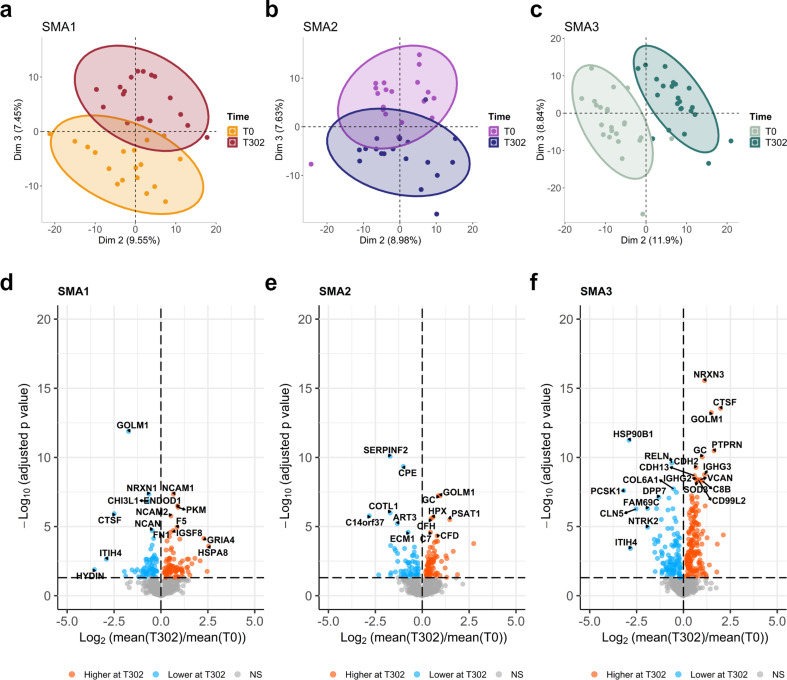
Fig. 3.
Nusinersen modulates CSF proteome at T302. The change in clustering based on proteomics between T0 and T302 is shown for (a) SMA1, (b) SMA2, and (c) SMA3 patients, based on second- and third-dimension combinations. PCA plots showing distribution and clustering of samples, and ellipses correspond to 95% confidence intervals for each time point. Volcano plots are used to show the down- or up-regulated proteins after nusinersen treatment for (d) SMA1, (e) SMA2, and (f) SMA3 samples. Significantly changed proteins (p.adj < 0.05) were colored on volcano plots based on their higher (orange) or lower (blue) abundances at T302 compared to T0

