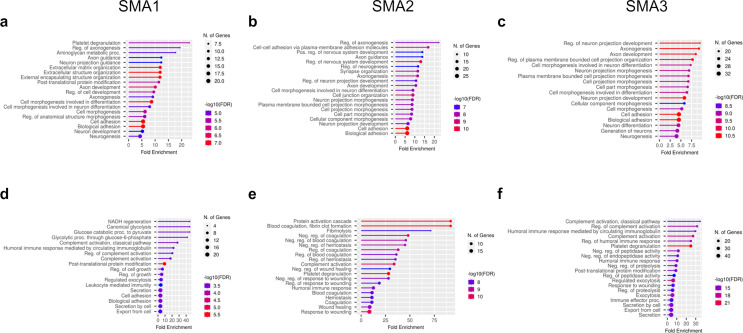
Fig. 4.
Biological processes modulated by nusinersen at T302. Top 20 GO pathways for biological processes (BP) enriched by mainly down-regulated (a-c) and up regulated DEPs (d-f), obtained from two clusters from each heatmap, are shown by lollipop plots for each SMA type. Fold enrichment represents the ratio of the percentage of matched proteins in the query list with pathway-associated proteins to the percentage of query with the background. Bar colors are corresponding to the false discovery rate (FDR) corrected p values for each enriched pathway, and the size of dots are proportional to the number of proteins associated with the respective pathway

