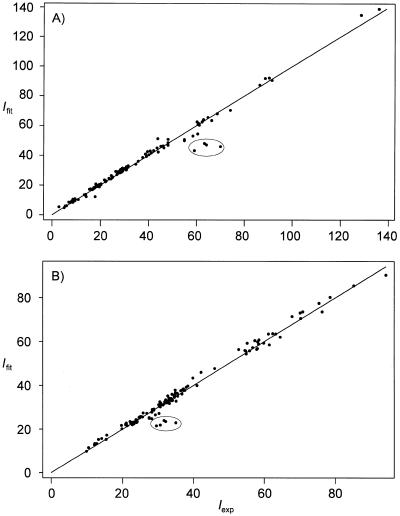
Figure 3.
Correlation plots of D2O NOESY cross peak intensities determined experimentally (Iexp) and from a two-dimensional fit (Ifit) of the (resolved) experimental cross peaks for both (A) 1 and (B) 2. Corresponding cross peaks across the diagonal were not averaged in these plots and the data points correspond to individual cross peaks. Plots such as these are useful for finding poorly fit cross peaks for subsequent refitting. For example, the circled peaks are due to underestimated volumes of methyl (ω2), H1′ (ω1) cross peaks.

