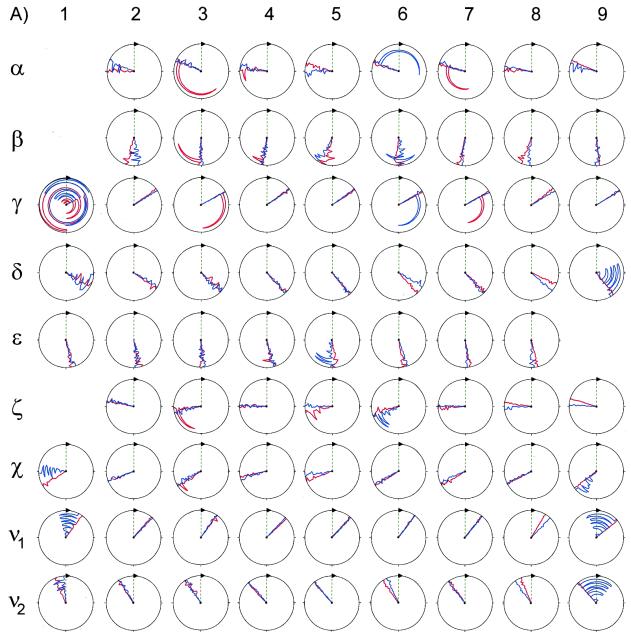
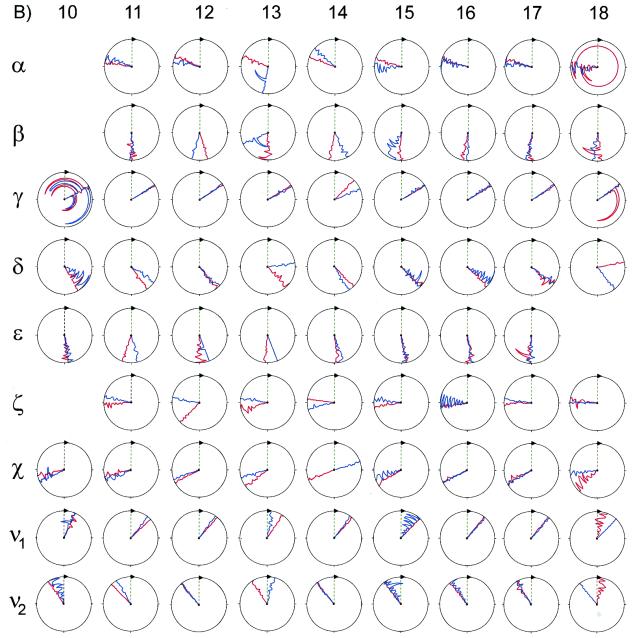
Figure 6.
Backbone and glycosidic dihedral angles of residues (A, opposite) 1–9 and (B, above) 10–18 for 1 and 2. Shown for 1 and 2 are the final 10 A- and 10 B-form derived structures. Values for 1 are plotted in blue, those for 2 are shown in red. The vertical green line represents a value of zero. Values for standard A- and B-DNA are, respectively, α (–sc, –sc), β (+ap, –ac), γ (+sc, +sc), δ (+sc, +ap), ɛ (–ac, +ap), ζ (–sc, –ac) and χ (–ap, –ac) (52,57,58). This figure was generated using the program MOLMOL (59).


