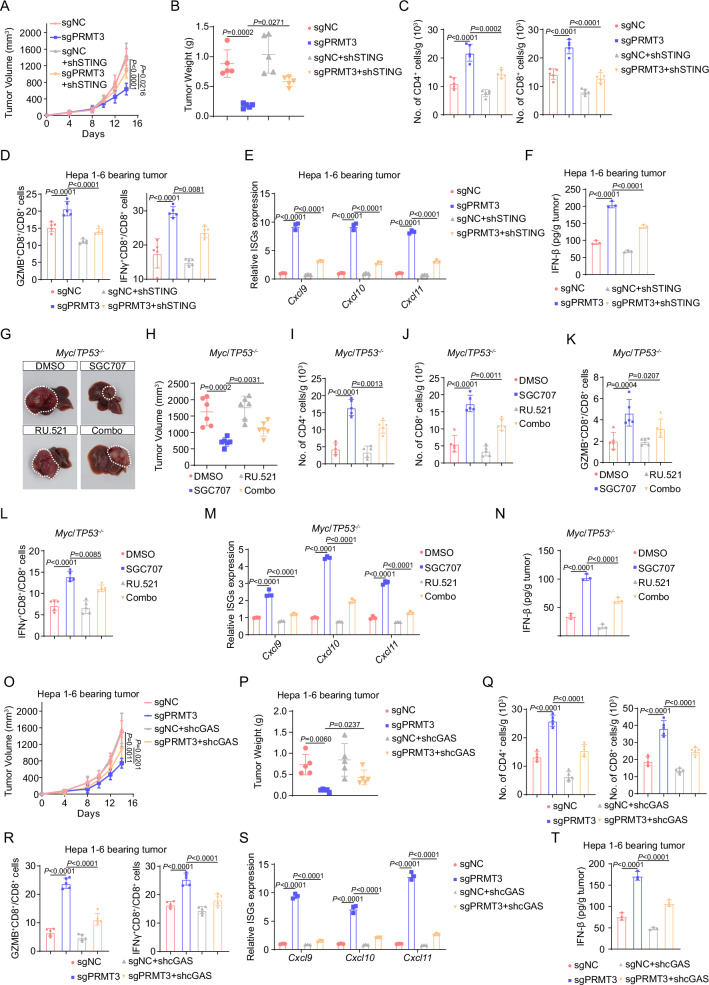
Fig. 7. The anti-tumor immunity induced by Prmt3-KO or inhibition was dependent on the activation of cGAS/STING signaling.
A The effect of STING-KD on the tumor growth of PRMT3-KO Hepa1-6 cells as shown by measurement of tumor volumes (n = 6). B The effect of STING-KD on the tumor growth of PRMT3-KO Hepa1-6 cells as shown by tumor weights at the endpoint of the experiment on day 14 (n = 6). C CD4+ and CD8+ T cells from the treated tumors were analyzed by flow cytometry for the indicated groups (sgNC, sgPRMT3, sgNC + shSTING, and sgPRMT3 + shSTING) (n = 5). Data were analyzed by FlowJo. D Flow cytometry analysis assessing the percentage of T cell functional markers IFNγ and GZMB from tumors in indicated groups. (sgNC, sgPRMT3, sgNC + shSTING and sgPRMT3 + shSTING) (n = 5). Data were analyzed by FlowJo. E The effects of STING-KD on the expression of ISGs in tumors from PRMT3-KO Hepa1-6 cells (n = 3 biologically independent samples). F The effects of STING-KD on the IFNβ production in tumors from PRMT3-KO Hepa1-6 cells as detected by ELISA assay (n = 3 biologically independent samples). G, H The effects of SGC707/RU.521 treatment on tumor volumes of Myc/Trp53−/− spontaneous model (n = 6). CD4+ (I) and CD8+ (J) T cells from tumors were analyzed by flow cytometry in indicated groups (DMSO, SGC707, RU.521, and Combo) (n = 5). Data were analyzed by FlowJo. Flow cytometry analysis assessing the percentage of T cell functional markers IFNγ (K) and GZMB (L) from tumors in indicated groups (DMSO, SGC707, RU.521, and Combo) (n = 5). Data were analyzed by FlowJo. M The effects of SGC707/RU.521 treatment on the expression of ISGs in Myc/Trp53−/− spontaneous model as shown by qRT-PCR (n = 3 biologically independent samples). N The effects of SGC707/RU.521 treatment on IFNβ production in Myc/Trp53−/− spontaneous model as detected by ELISA assay (n = 3 biologically independent samples). O The effect of cGAS-KD on the tumor growth of PRMT3-KO Hepa1-6 cells as shown by measurement of tumor volumes (n = 6). P The effect of cGAS-KD on the tumor growth of PRMT3-KO Hepa1-6 cells as shown by tumor weights at the endpoint of the experiment on day 14 (n = 6). Q CD4+ and CD8+ T cells from the treated tumors were analyzed by flow cytometry for the indicated groups (sgNC, sgPRMT3, sgNC + shcGAS and sgPRMT3 + shcGAS) (n = 5). Data were analyzed by FlowJo. R Flow cytometry analysis assessing the percentage of T cell functional markers IFNγ and GZMB from tumors in indicated groups (sgNC, sgPRMT3, sgNC + shcGAS and sgPRMT3 + shcGAS) (n = 5). Data were analyzed by FlowJo. S The effects of cGAS-KD on the expression of ISGs in tumors from PRMT3-KO Hepa1-6 cells (n = 3 biologically independent samples). T The effects of cGAS-KD on the IFNβ production in tumors from PRMT3-KO Hepa1-6 cells as detected by ELISA assay (n = 3 biologically independent samples). Data in (A–E, H–T) are presented as mean ± SD. Data were analyzed by one-way ANOVA in (A–E, H–T). Source data are provided as a Source Data file.

