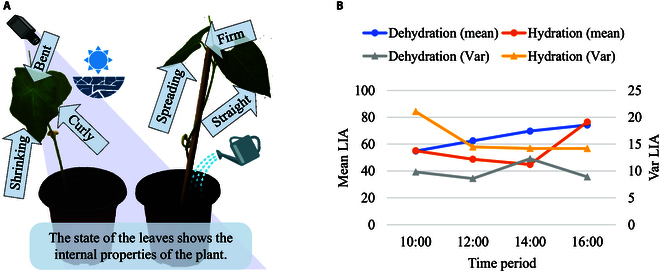
Fig. 8.

Association of LIA with plant physiological status, taking hydration as an example. (A) The plant on the left demonstrates the characteristic appearance of bent, shrinking, curly leaves under conditions of water deprivation. The plant on the right shows how the leaves look when well watered. (B) Changes over 8 h in the different plants’ LIAs. The mean LIAs of the 2 groups show different tendencies of change with time. The variances of LIAs for each group present the distribution of LIA in different time periods.
