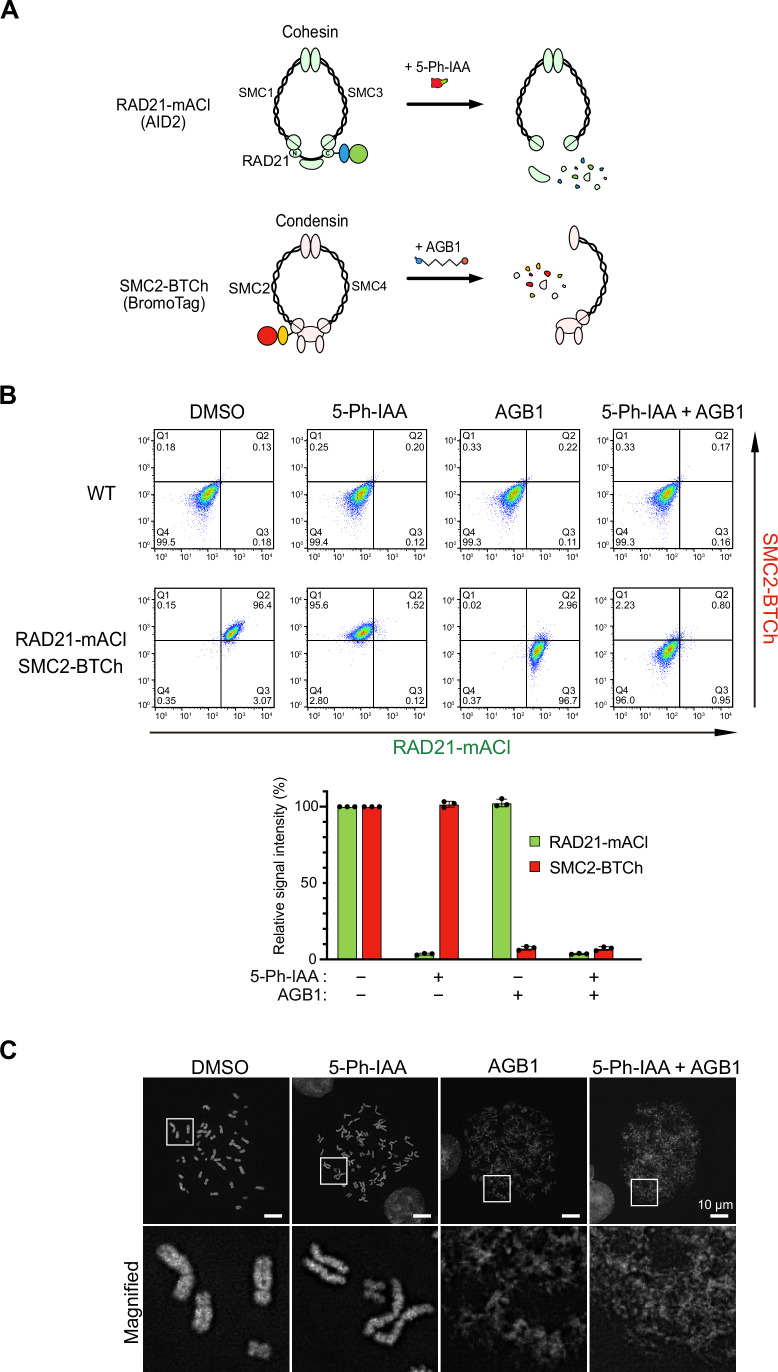
Figure 3. Independent and simultaneous depletion of RAD21-mAID-mClover (RAD21-mACl) and SMC2-BromoTag-mCherry2 (SMC2-BTCh).
(A) Schematic illustration showing degradation of RAD21-mACl and SMC2-BTCh in the cohesin and condensin complexes, respectively. (B) Top, density plots of the cells treated with 1 µM 5-Ph-IAA, 0.5 µM AGB1 and both for 2 h. The X and the Y axes are the signal intensity of RAD21-mACl and SMC2-BTCh, respectively. Quadrant gates (Q1–Q4) were set manually to include 99.5% of the single cells in the Q4 area using a negative control (DMSO-treated WT cells). Bottom, the density plot data were quantified to make this graph. Data were presented as mean ± SD of three technical replicates (n = 3). The signal intensities in each condition were normalized with DMSO-treated control cells. (C) Representative DAPI-stained chromosomes from RAD21-mACl/SMC2-BTCh cells after treating them with the indicated ligand for 3 h. The scale bars indicate 10 µm. Source data are available online for this figure.

