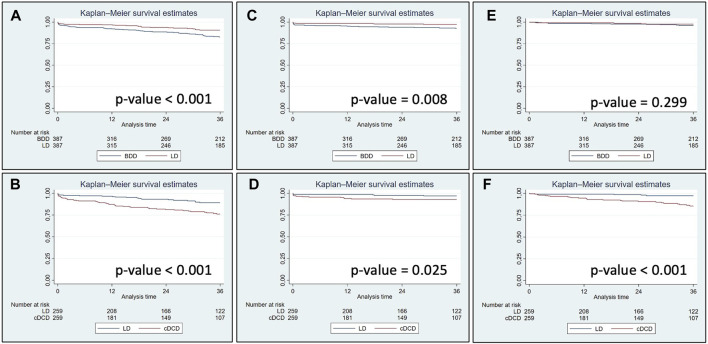
FIGURE 4.
Graft survival including patient death (A, B), death-censored graft survival (C, D) and patient survival (E, F) in kidney transplants performed during 2013–2021 in the European cohort matched by the propensity score. Log-rank p-value for all comparisons is displayed. LD, living donors; BDD, donors after brain death; cDCD, donors after controlled circulatory death.

