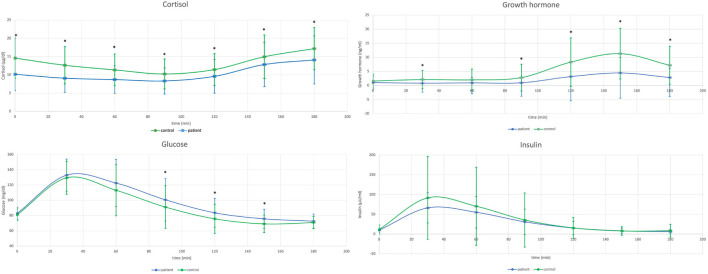
Figure 1.
Comparison of cortisol concentrations during glucagon stimulation test (GST) in healthy controls (n=77) versus patients with a history of pituitary disease (n=62) - upper left, and comparison of growth hormone concentrations during GST in healthy controls versus patients with a history of pituitary disease - upper right. Lower left: Comparison of glucose concentrations during GST in healthy controls (n=77) versus patients with a history of pituitary disease (n=62), and lower right: comparison of insulin concentrations during GST in healthy controls versus patients with a history of pituitary disease.

