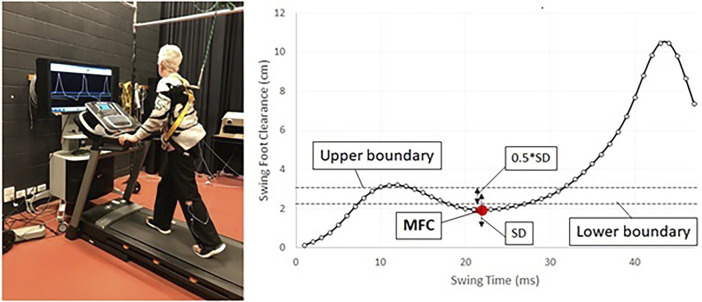
FIGURE 1.
The diagram depicts a person engaged in treadmill training while receiving real-time biofeedback. The training aims to regulate minimum foot clearance (MFC) data within a target band, indicated by a red dot. The target band is defined by the (mean + SD) (0.5*SD) (standard deviation) of MFC, establishing the upper and lower boundaries (Nagano et al., 2022). Adapted from Nagano et al. (2022), licensed under CC-BY 4.0 and the authors have made no changes to the original figure.

