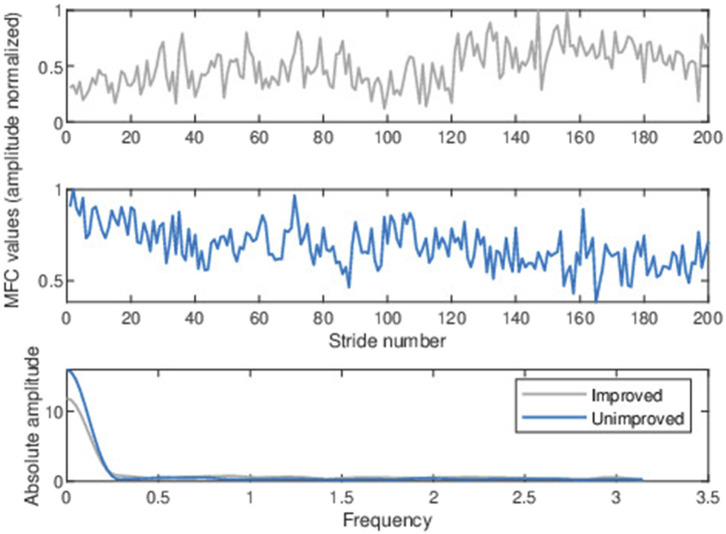
FIGURE 3.
Typical baseline normalized MFC height series for an arbitrarily chosen stroke patient (upper panel) who improved after training and another patient who did not improve after training (middle panel). The magnitude (absolute amplitude) spectrum was computed from the normalized baseline MFC data above (lower panel).

