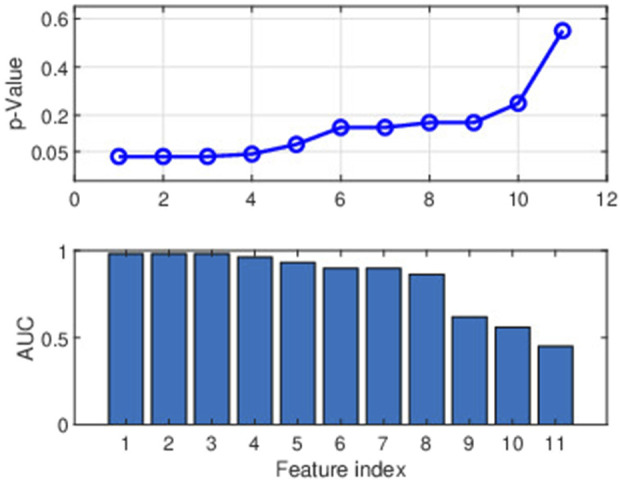
FIGURE 6.

The figure depicts the two parameters (p-value and AUC) for selecting the spectral features. The upper panel represents the significance of 11 features across lower frequencies using p-values. The first 11 features consist of the DC value and the absolute amplitudes (magnitudes) corresponding to the first 10 frequencies (frequency range of 0–0.2545 cycles/stride). The lower panel shows the efficacy of modelling individual characteristics regarding AUC values.
